|
Starting with the function

Your goal is to modify the function so that we can use it to model a real-life problem. We want to be able to control the following things:
- Change the height of the horizontal asymptote on the right, we'll denote it by
 . .
- Change the
 -intercept to any number between -intercept to any number between  and and 
BONUS (just the point below, not what comes after)
- Change the slope of the curved part. Find a way so that the slope can go from very close to zero to almost vertical. (If you graph it, it should be quite clear).
Once you've played with the function enough, try to find an application of the graph to model something. It can be anything which starts at a value and then goes to another one (think for a population, it goes from 0 to it's carrying capacity). Explain what you are modelling and how you decide to attribute a numerical value to each of the 2 or 3 parameters that you researched just above. Then use the model to make a prediction. For example, if your model is suppose to describe a population for which you have its initial population and carrying capacity (potentially its rate of increase if you solved the bonus part), then use that data to make a prediction for the population in 20 years, or use the model to predict when will the population reach 95% of its carrying capacity).
When doing this last part, explain well where you're taking your data from (real data or imagined data), what it is that you're modelling and how you are doing the math to answer a predictive question.
Solution
Changing the Height of the Horizontal Asymptote
Change the height of the horizontal asymptote on the right, we'll denote it by K.
This is the graph for:

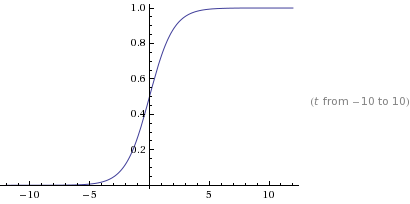
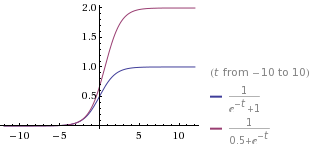
We have found that if we change the '1' in the denominator to 'k', any constant, we can change the height of the horizontal asymptote to the right.
The smaller the number we put for k, with k > 0, the higher the height of the horizontal asymptote to the right, as shown in the graph below.
Changing the y-intercept
Change the y-intercept to any number between 0 and K
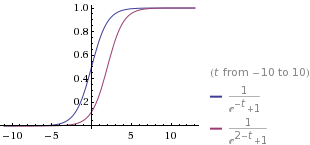
We found that to change the y-intercept, we manipulate the value of t by adding to it any constant, 'k'. The bigger the number k we add to t, the smaller the value of the y-intercept.
Modelling to a Real Life Problem
4 people were stranded on a shipwrecked island.
We used our model:

to model the maximum carrying capacity of the island and how many years it takes for the population to reach the maximum capacity, assuming the population growth is constant.
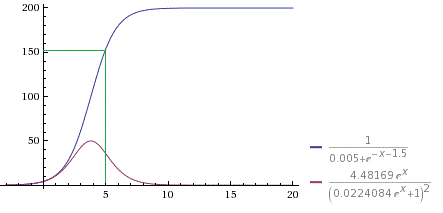
From the equation and the graph above, we can predict that after 5 years the population will rise to 153 people.
The derivative of P(t) is  . As the function P(t) travels toward the horizontal asymptotes . As the function P(t) travels toward the horizontal asymptotes  , the P'(t) goes to zero , the P'(t) goes to zero  .It Indicates that horizontal asymptotes has slope zero and the island maximum capacity is 200 people. .It Indicates that horizontal asymptotes has slope zero and the island maximum capacity is 200 people.
Bonus Part
We have figured out that the only way to change the slope of a equation without affecting the y-intercept is to times the t with a constant(c).  .When we put t equals to zero, it changes the constant c to zero as well. so, the y-intercept would not change. However, when we compute the derivative of it, the equation would be different and so as the slope. .When we put t equals to zero, it changes the constant c to zero as well. so, the y-intercept would not change. However, when we compute the derivative of it, the equation would be different and so as the slope.
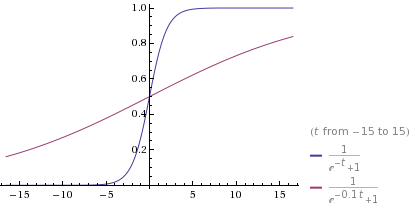 
so, as we can see when C is greater than 1, the curved part would be more vertical. when C is less than 1 but greater than zero, the curved part would be more horizontal.
|