Course:MATH110/Archive/2010-2011/003/Teams/Zug/Homework 11
Homework 11

Write a linear model to predict the cost of producing flags of your team's Canton under the assumptions that the marginal cost is $7 per unit and that at the current production level of 20 items, the cost is $100.
* Describe your model
The model we came up with is:
C = 7x – 40
x = number of flags
C = total cost
M = marginal cost
The marginal cost is 7, and at the production level of 20 (i.e. x = 20) the cost is 100 (C=100)
So, here 100 = 7(20) + m (where m is the constant in the linear equation)
Therefore m = -40, thus the equation is
C = 7x - 40
* What does your model predict for a production of 150 items?
C = 7x - 40
plug in 150 for x
Therefore:
C = 7(150) - 40
C = $1010
Our model predicts that with the production of 150 items, the cost is $1010
* According to your model, what happens to the average cost per item as production levels increase?
As the number of items rises from 150 to 200 for example, at 150 items
C=1010
Therefore the average cost 1010/150 = 6.733
At x =200,
C=7(200)-40 = 1360
Therefore, the average cost is 1360/200 = 6.8
Thus, as the output level increases, the average cost increases
* Finally, find some other models (not necessarily linear) for which you get other behaviours such as:
- The average cost remains constant as production increases.
If the average cost is to remain constant the marginal cost must equal the average cost. One model that would illustrate this would be:
C(m)= mx
C = total cost
x = number of flags
m = marginal cost
As the marginal cost of producing a flag is $7 and we are producing 20 flags, therefore
C(20) =(20)(7)
C = $140
And the average cost is calculated by dividing the total cost by the output quantity (m)
140/20 = $7
If we were to increase the output quantity, the average cost should still stay the same
C(30) =(30)(7)
C = $210
210/30 = $7
From this we can see that the average cost is indeed constant.
- The average cost diminishes as production increases.
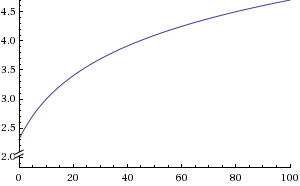
When the average cost is diminishing as the production increases, if we have a graph of with the y axis being cost and the x axis being number of items produced, the slope of the curve (denoting cost per unit) should be decreasing as output increases.
So when,
C = total cost
x = number of units
A good way to show that kind of a curve is by using the function:
C = ln(x+m) [m being any positive constant!!]
The graph would probably look like this.
The y-intercept being the fixed cost.
- The average cost increases as production increases.
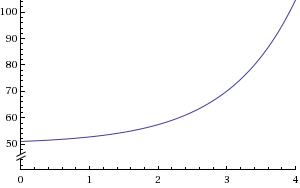
Just like the previous answer, when the average cost is increasing, the slope of the cost/number of items graph should have an increasing slope.
So when,
C = total Cost
x = number of units
A good example of a curve like such would be C = e^x + m [m being any positive constant]
The graph would look like this.
The y-intercept being the fixed cost again.
- You obtain an economy of scale. This means that starting at some specific production level, the marginal cost is always less than the average cost.
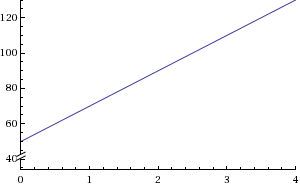
The Marginal cost is the cost of producing the last unit. If we assume that the marginal cost is constant through all levels of items produced, then the Cost/number of items would be a linear equation like:
C = 20x + 50
(20 being the marginal cost here, and 50 being the fixed cost)
Now for a company that is Economies of Scale, any curve with a constant or a decreasing slope to the right of the marginal cost graph, would fulfill the conditions!


