Course:MATH110/Archive/2010-2011/003/Teams/Ticino/Homework 12
Altering the Graph of a Logistic Function
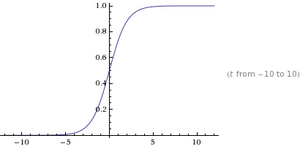
The original function looks like:
_____________________
To change the height of the horizontal asymptote to k, we can add k to the formula as follows:
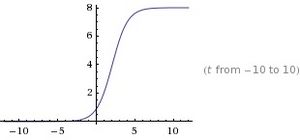
The graph shows what happens when k = 8:
The graph shows that when we add k to the original equation the horizontal asymptote is now 8 instead of 1. k increases the height of the function. _____________________
In order to change the y-intercept of our function, we can add any number, q, where q is any value between negative infinity and infinity, as shown:
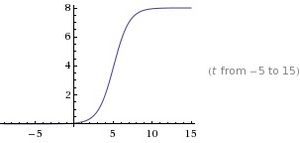
The graph shows what happens when k = 8 and q = 3:
Compared to the graph above the y-intercept is lower with the addition of q
_______________________
BONUS: to change the slope of the function, multiply t by s, where s is any number.
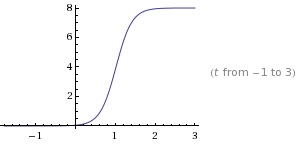
Here's what happens when k = 8, q = 3 and s = 5:
Applications of the data
Our group has chosen market share as a real life example of our model. Specifically we have focused on the Lexus brand of luxury cars and how the sales of these cars can represent a logistic growth function over time.
We have denoted the X axis as time (measured in 10’s of years), and our Y axis as the number of Lexus’ sold. In the beginning as the Lexus brand comes out with a new car, initially there will be great increase in consumer interest thus increasing the number of cars sold. However, this example reflects our model as there is a fixed constraint, creating a vertical asymptote, at which the number of Lexus’ will never exceed. The fixed constraint in this case is the number of consumers with the means of purchasing the brand, as well as market share. At a certain point, denoted on our graphs at 8 (on the y-axis) marketing stops being affective regardless of effort to sell more of the product. The substitute goods as well as income levels will level the graph off at 8. The number of product sold is therefore dependent on the market. An increasing, steep slope indicates more sales of the car which suggests an effective marketing campaign. Likewise, a decreasing slope suggests the marketing campaign is ineffective and the company should do something to increase sales.
The y-intercept represents the current number of cars sold, the beginning stages of a growing company. Our final altered graph, where our x-axis is years and our y-axis is millions of cars sold, our model predicts that with a very successful advertising campaign, in 18 months we should expect to have sold approximately 6.5 million cars.


