Course:MATH110/Archive/2010-2011/003/Teams/St Gallen/Homework/11 Part3
Write a linear model to predict the cost of producing flags of your team's Canton under the assumptions that the marginal cost is $7 per unit and that at the current production level of 20 items, the cost is $100.
The linear model that we came up with was . Where C = cost of the production in dollars; X = the amount of items being produced.
Describe your model.
C = cost of the production
X = the quantity of the production
After the production of the initial 20 units (with a total cost of 100$), the cost of producing an additional unit is $7 each. Therefore the marginal cost of producing every additional unit increases. Moreover, if the cost of producing the first 20 units were 7$ each, the total cost of producing the first 20 units would be 140$ rather than the 100$. This implies a 40$ change from the original cost of production which is then equated into our formula .
What does your model predict for a production of 150 items?
By using the above equation . Where C = cost of the production in dollars; X = the amount of items being produced. We substitute 150 items into the X to find the cost of the total production, .
According to your model, what happens to the average cost per item as production levels increase?
According to our model, the average cost per item, as production levels will increase by approximately 1.73 dollars per each extra item produced.
The average cost remains constant as production increases.

The diagram above shows a constant average cost, as extra product is being produce. As given the quantity of 20 items, the price for the output remains the same and it is given the cost of $100 for the production of 20 items. Therefore the model for the above can be given as Y = 100.
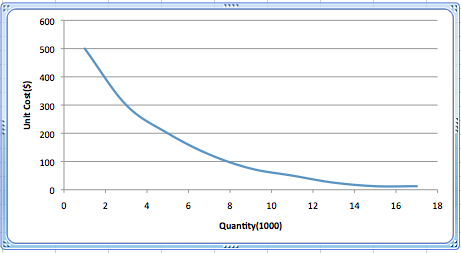
The average cost diminishes as production increases.
An average fixed cost is calculated by dividing total cost by the quantity produced ,the graph is represented graphically as an ever decreasing asymptote to the horizontal axis. An example being, the rent paid by a restaurant is divided among more and more meals as the volume of production increses, the average cost per meal is attributable to the decreased fixed rent as the number of meals increase. General formula: P=1/Q as X>0
The average cost increases as production increases.

The model P=Q+2^Q where P is price and Q is the number of items increases the average cost exponentially as production increases. We can look at the graph of this function to see the relationship between the average cost and production.
As you can see from the graph as the quantity increases the average cost increases. 3 items will cost $11 while 8 items will cost $264. The average cost for the 3 items is $3.66 while the average cost for items is $33.
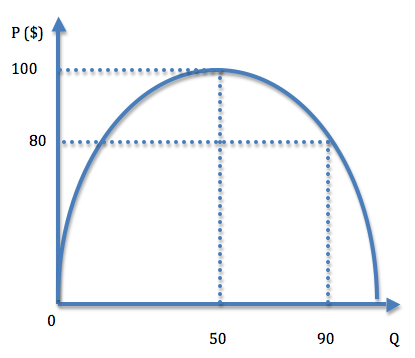
You obtain an economy of scale. This means that starting at some specific production level, the marginal cost is always less than the average cost.
When observing the diagram above we notice that the parabola reaches its vertex as the quantity being produced arrives at 50 (100$). However, after this specific point the graph begins to form an economic model known to us as economies of scale. This model implies that the higher the amount of units being produced, the cheaper it will be to create each individual unit. On a side note, economies of scale could derive from various different situations, perhaps the company has decided to specialize in producing this single product which in turn would allocate resources to make the production of this item cheaper. Or maybe they have found an alternative and more efficient method of specialization when producing this item in bulk.
Other interesting properties that you can think of and create a model for.

In the above diagram, there is an increase in the average cost as extra unit of production is being produced, this is also known as the reverse of economic of scales. As the production increases from 25 items to 30 items, we can see that there is an increase in the cost of producing the product from $60 to $110. Therefore the average cost for producing 25 items will increase approximately 20% in the price. The model for the above diagram could be written as Y = (() – 20) + 30.


