Course:MATH110/Archive/2010-2011/003/Teams/Neuchatel/Homework 13

What is a logarithmic scale?
A logarithmic scale is a measurement scale based on logarithms. The values on the y-axis increase exponentially on this scale. Logarithmic scales are particularly useful when we want to analyse quantities that vary over a large range. Making use of the logarithmic scale enables us to increase the range over which numbers can be seen in a meaningful way.[2]
Examples are mostly found in the fields of the Sciences and Engineering, although they are also useful in a wide net of other areas, such as in measuring the casualty from different wars throughout history [3]. For our example, we make one war casualty (let's say, instead of human lives lost, the number of pot plants that die when a building is blasted), correspond to a certain magnitude. A terrorist attack on a high-rise office building that killed 970 pot plants would correspond to a magnitude of 2, one that resulted in 5000 death of pot plants would correspond to a magnitude of 6, etc.[4].
What does it mean that the Richter scale works on a logarithmic scale?
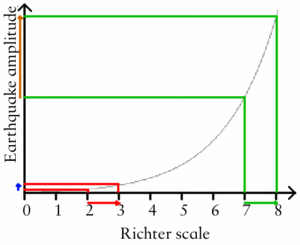
The increase in magnitude by one point on the Richter scale equals an increase of 10 times the kinetic energy from the previous point. That is to say, the Richter scale is logarithmic. An earthquake that measures 8 on the Richter scale, for example, is ten times as powerful as one that measures 7, and in turn, is times as powerful as one that measures 4 (There is a four units difference between 8 and 4), and so on.[5]
The Richter scale, which is the measure of seismic energy released by an earthquake, works on a base 10 logarithmic scale. The values are acquired by calculating the logarithm of the amplitude of the waves on a seismometer(device for measuring earthquakes). The reason for this is to simplify the graph of the Richter scale. For example if there was no logarithmic scale a level 1 earthquake , and a level 6 earthquake would be very hard to graph and you would need a very larger scale.
Whereas if there is a logarithmic scale, level 1 and and level 6 are easy to graph and can be viewed in a linear fashion, even though their values of energy released are not linear. The linear and logarithmic graphs are the same. The y-axis on the graph below corresponds to what the log base 10 is being raised to. Hence, for level 1 it's and level 6 it's . On a non linear graph the y-axis is the the actual values of what and equal. This helps in plotting various levels of earthquakes easily.
References
- ↑ http://www.explainthatstuff.com/earthquakes.html
- ↑ http://www.splung.com/content/sid/1/page/logs
- ↑ http://www.splung.com/content/sid/1/page/logs
- ↑ Concept from http://www.splung.com/content/sid/1/page/logs. We have the copyright for our own example
- ↑ With integration of the resources on these websites, which basically talk about the exact same things: http://www.explainthatstuff.com/earthquakes.html, http://www.physicalgeography.net/fundamentals/10m.html, http://www.suite101.com/content/earthquake-magnitudes-a223590


