Course:MATH110/Archive/2010-2011/003/Teams/Jura/Homework/11 Part3
Write a linear model to predict the cost of producing flags of your team's Canton under the assumptions that the marginal cost is $7 per unit and that at the current production level of 20 items, the cost is $100.
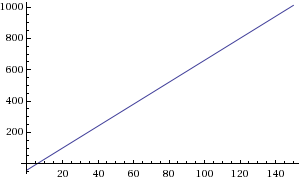
The following linear equation is a model to predict the cost of producing flags of a Canton under the assumption that the marginal cost is $7 per unit and that at the current production level of 20 items, the cost is $100. C(F) = 7F – 40.
Describe your model.
What does your model predict for a production of 150 items?
This model predicts that at the production of 150 items, the cost $1010.
According to your model, what happens to the average cost per item as production levels increase?
According to this model, the average cost per item will increase as production levels increase.
The average cost remains constant as production increases.
A model with this attribute has a constant slope. Therefore an equation of this type of model would be linear and look like:
C(F) = XF
For example:
C(F) = 7F
C(F) = F
The average cost diminishes as production increases (-,+)
Average Cost = total cost/production
A new model example: The marginal cost of a 3D t.v. is $400 dollars per unit at current production of 10 items, the cost is $5000 dollars.
C(10) = 400(10) + x
C(10) = 4000 + x
5000 - 4000 = x
x = 1000
C(F) = 400F + 1000
Average Cost = total cost/production
C(10) = 400(10) + 1000 = 5000/10 = 500
C(20) = 400(20) + 1000 = 9000/20 = 450
C(25) = 400(25) + 1000 = 11000/25 = 440
Conclusion: the data shows that the average cost becomes smaller as production increases
AvgC becomes smaller when Production increases
The average cost increases as production increases.
Average cost becomes larger when Production becomes larger (+,+)
Average Cost = total cost/production
New model: The marginal cost of a pair of runners is $8 dollars per unit and that at the current production level of 50 items, the cost is $200 dollars
C(F) = 8F - 200
The average cost is getting larger when production becomes larger shown by substituting larger production quantities into the function for F.
C(50) = 8(50) - 200 = 200
C(51) = 8(51) - 200 = 208
Average Cost = total cost/production
C(50) = 200/50 = 4
C(51) = 208/51 = 4.07
This represents that the function C(F) is increasing and on a graph shows that as one moves up the function both production and average costs are increasing.
You obtain an economy of scale. This means that starting at some specific production level, the marginal cost is always less than the average cost.
Before we begin to describe our model for an economy of scale, it will be helpful to understand exactly what an economy of scale is. With this term being somewhat novel to our group, our research instructed us that economies of scale describes the decreased per unit cost as the number of units of production increases. Basically, it means that when our flag corporation produces a certain amount of flags, that our corporation will realize a reduction in the per unit cost of our flags as our corporation's production level increases.
We can think of this definition contextually by examining Walmart. Walmart is a good example at a corporation that exploits the notion of economies of scale because it purchases its supplies in bulk. This mass purchasing of supplies allows Walmart to buy these supplies at a discount which ultimately allows them to sell their products at a lower cost than most of their competitors.
Before we present our model, it will be helpful to explain a few details in order to gain a better understanding in how our model works. Initially, our flag corporation can produce the first 20 flags in an order for $100.00. Any extraneous flags in that particular order will cost us an additional $7.00 per flag. From our above linear model, we can see that any additional extraneous flags actually cost more per unit when compared to the $5.00 per unit we were charged for placing an order of 20 flags. This fact is a bit disturbing because our supplier is punishing us for purchasing more than 20 flags! It's almost like our supplier does not want us to buy more from them. Because of this fact, our initial figures need to be changed to illustrate the economy of scale phenomena. Rather than punishing us, our supplier makes the following changes to their pricing to encourage bulk purchases. The following changes are illustrated in our chart listed below and one can see that as our production level increases, our cost per unit actually decreases.
Here is a following chart that demonstrates the economy of scale phenomena: File:110 jura graph.xlsx. You can see our formulas by clicking each respective cell in the chart. Feel free to play with the inputs as well. The inputs are shaded brown and the chart will automatically update according to your inputs.
One key note that we must address is that the marginal cost per unit should be cheaper than the production level cost per unit because marginal cost is the extra amount we have to pay past our production level. Since we are Jura Corporation, it is honourable for our supplier to reward us with a discount if we buy in bulk! Also, the unit price cannot keep on getting cheaper. Even though Jura Corporation is purchasing in bulk, we will eventually reach a limit where the discounts will remain stable.
Other interesting properties that you can think of and create a model for.
Since we have examined economies of scale, it would be interesting to take the opposite meaning of this definition. That is, as Jura Corporation increases, the per unit cost also increases. It is feasible to imagine that Jura Corporation can become too large for its own good and this increase could actually lead to increase prices.
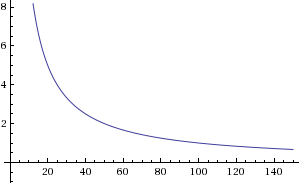
One interesting model that may act as a cost/production model is the family of functions Y=1/x.
This would be a good model for selling something on a mass production. For example, If we wanted to sell keychains and it cost us $.25 to make, we can calculate possible prices we can sell them for. In this case we can use a function like Y=100/x. We could say something like there is a minimum order of 40 ($2.50 a keychain) and the more you order the cheaper it would be. Of course, we'll do a cut off in discount like you'll stop receiving the discount at 150 keychains ($.67 cents). Now if we wanted to order 120 keychains, we'll plug 120 into the function and get the value 83.33 cents. So the total price of a wholesale order of 120 keychains would be (120*83.33) $99.60.
Y=100/x

