Course:MATH110/Archive/2010-2011/003/Teams/Geneve/Homework 12
Homework 12
Start with the Function
1) Change the height of the horizontal asymptote on the right and denote it by K.
2) Change the y-intercept to any number between 0 and K.
- BONUS - Change the slope of the curved part. Find a way so that the slope can go from very close to zero to almost vertical.
Solution
1) We first found where the graph displays horizontal asymptotes. In order to do this we took the limit of the function as t approaches infinity. This told us as t becomes larger and larger, the function f(x) or "y" becomes arbitrarily close to 1, proving to us we had a horizontal asymptote on the right side of the graph. In order to raise this horizontal asymptote on the right side of the graph, we multiplied the whole function by a factor K. Since the numerator is 1, you can simplify and change the graph to:
K must be equal to or larger than 1, or the horizontal asymptote will lower.
2) To change the y-intercept and to ensure it stays between 0 and K, we shifted the graph to the right. To do this we added any constant h to the the variable t. rewriting the equation:
K can be any value from negative INF to positive INF
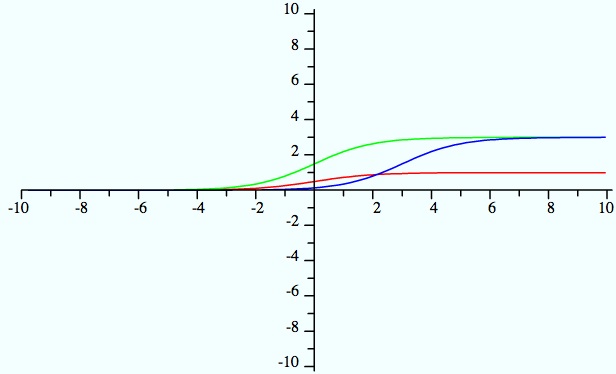
In the following graph we set K to 3.
Red = original graph
Green = Shifting of horizontal asymptote higher
Blue = Changing the y-intercept
BONUS
- Change the slope of the curved part. Find a way so that the slope can go from very close to zero to almost vertical. (If you graph it, it should be quite clear).
Once you've played with the function enough, try to find an application of the graph to model something. It can be anything which starts at a value and then goes to another one (think for a population, it goes from 0 to it's carrying capacity). Explain what you are modelling and how you decide to attribute a numerical value to each of the 2 or 3 parameters that you researched just above. Then use the model to make a prediction. For example, if your model is suppose to describe a population for which you have its initial population and carrying capacity (potentially its rate of increase if you solved the bonus part), then use that data to make a prediction for the population in 20 years, or use the model to predict when will the population reach 95% of its carrying capacity). When doing this last part, explain well where you're taking your data from (real data or imagined data), what it is that you're modelling and how you are doing the math to answer a predictive question.
BONUS Solution
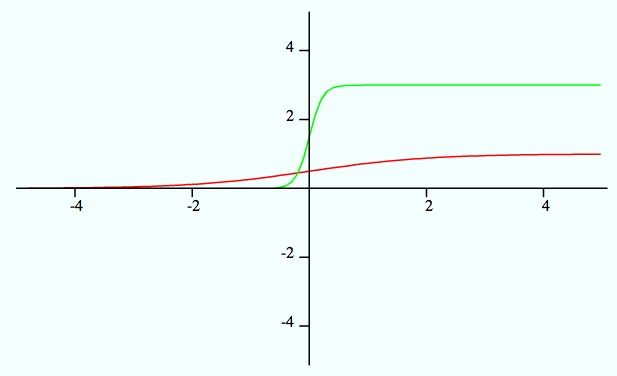
In order to shift the slope of the graph, we must alter the t variable. By adding a coefficient in front of t, you can either increase the slope to almost one (m > 0), or decrease the slope (m < 0).
Red = original equation
Green = Heightened horizontal asymptote on right side and increased slope to near 1
Model
You can use this function for any type of logistical growth, commonly applied to population growth (whether it be humans, bacteria, animal, or even tumor cells).


