Course:MATH110/Archive/2010-2011/003/Groups/Group 06/Basic Skills - Piecewise Functions
What is it?
A piecewise function is a function which is broken up into different pieces, each piece is defined on a certain interval. These intervals depend on the independent variable (x) and define the function.
Regular functions usually apply the same process no matter which number it is given, whereas a piecewise function will look at the number first and based on that number itself and where it is found, will decide which formula to put that number into.
For example, this is a piecewise function
So the "formula" 5x+2 is only used when your independent variable "x" is smaller or equal to 0. If the value of "x" is any greater than 0 you must use the "formula" x+2 to find the value of your function at that point. These two pieces define the whole function.
Piecewise functions are useful for graphing curves that differentiate over their domains, such such as in economic models where major factors (ie. factors of production) are altered over the changing domain.
How to Graph them
A piecewise function is graphed by graphing each of the "pieces" over the function's specific domain, as defined by an inequality or interval statement.
An easy way to do this is to graph each of the functions on your plot, and then erase portions of each function based on the domain statements.
A simple example is the absolute value of f(x)= |x|, we can break this function up into two pieces (Yes a piecewise function!).
Look at the domain restriction of each "piece" and simply draw each of the functions on a graphing plane and then erase the part of the function that is out of the range of its specific inequality.
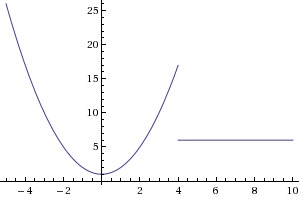
Most piecewise functions you come across will not look this simple, lets look at a slightly more complex looking piecewise function:
It may be easiest, and a good habit, to start off by drawing vertical dotted lines on the graph where your dividing line(s) is/are. For this example their is only one and it would be "4" (you can tell by looking at the restricting domains). Draw each of the functions on a graph until that restricting line, if that portion of the graph includes that point () draw a circle which is filled in, if not than leave the inside of the circle uncolored.
So, for F(x) = x^2+1, erase any part of the function that appears to the right of x=4. You are doing this because x^2+1 is only the valid function for any values of x that are smaller than 4.
Video
Here is an awesome video giving a very clear demonstration on how to graph piecewise functions when x is defined between 2 values, ie: . This video points out the importance of knowing what each piece looks like before graphing the whole function.
Continuity in Regards to Piecewise Functions
In order to analyze if a function of "f" is continuous at a point one must look and see if the point satisfies the following, if a=x :
1. "a" is in the domain of f which means it is defined everywhere in the function
2. constitute functions of f are continuous throughout the function
3. discontinuity doesn't exist at the end points of each functions intervals.
Basically if a graph is continuous it will have no holes or breaks, however it may twist, turn and change direction (each of these are pieces). A good basic rule is: If you can draw the whole graph without lifting your pen from the paper it is continuous.
Piecewise functions are made up of a finite number of continuous pieces. One taboo for continuous piecewise functions are vertical asymptotes, they cannot be continuous when they have vertical asymptotes. Although it is possible for a continuous piecewise function to have removable and step discontinuities. Why? Because you can redefine x at this point, and in doing this you make the function continuous. With a vertical asymptote you cannot redefine x to make the asymptote disappear as you can with the other discontinuities (See below for examples).
How to modify them?
Modifying to make continuous
We have talked about piecewise functions which only have x and y as "unknown" variables. What about situations when their is another variable thrown in to represent a coefficient which can make the function continuous if the right value is plugged in.
Say you have a function:
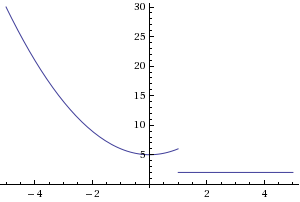
Depending on the value of a, the two graphs may or may not join together. What if we want it to be continuous? What value must "a" be for this function to be continuous (remember this does not mean it is differentiable).
For the function to be continuous the graphs from each "piece" must connect, we need to find the value of "a" which will make the "pieces" connect. Looking at the defined domains of each piece, you can see the point at which they break up is when x = 1. This is the part of the graph we want to focus our attention on and find a value which will make the two pieces meet at this point.
If we put 1 into the first piece
The point at which this piece stops is at (1,6). For the function to be continuous the second piece must start at this point (1,6). So when x=1, the second piece must equal 6
Solving for "a" we get a = 16.
In order for this piecewise function to be continuous "a" must equal 16.
Is 16 the only value for a which makes the function continuous? Lets make a = 4.
You can see there is a break in the graph at x = 1, therefore it is not continuous. You can plug in any other value into a and it will give you a graph, however it will not be continuous.
Removable discontinuity
Why is it above we described a piecewise continuous function as one which can have a removable discontinuity? This is because if we modify it slightly we can we can make it continuous. All you need to do is redefine the point at which it is discontinuous.
Say you have a function
Since x is NOT defined at x = -3, we must redefine this point (technically the graph should have an open circle at x=-3, in order to make this functions continuous
So our function, after redefining, will look like:
The graph for this function will look exactly the same however where there was a circle with a hole at x = -3 there will now be a filled in circle to indicate this point is defined. It is now continuous.
Piecewise function with an asymptote
Can we make this continuous? Lets try, what value must "a" be for this function to be "continuous".
Remember we look at the defined domains of each piece, the point at which they break up is when x = 1.
If we put 1 into the first piece
The point at which this piece stops is at (1,2). For the function to be continuous the second piece must start at this point (1,2). So when x=1, the second piece must equal 2
Solving for a we get a=12.
In order for this piecewise function to be continuous "a" must = 12. The graph below shows the continuity of the function when a = 12, notice the vertical asymptote.
The vertical asymptote is a point on the graph where x approaches but never reaches (from left and right side). Can you draw this graph without lifting your pen? No, therefore the function cannot be defined as continuous. The function is UNDEFINED at x = -3, you can say the graph is continuous everywhere but where it is undefined.
Differentiability in Regards to Piecewise Functions
In graphing this function we realize it is not differentiable, because when you take the derivative the two pieces do not match. In order for a function to be differentiable it must satisfy two conditions:
1) Be continuous
2) The "pieces" must match with the same slope
What does this mean?
Different Types of Step Functions
Step Functions: are functions that look like steps when plotted on a graph and they follow the same piecewise rules. They are also called linear piecewise function graphs. The reason behind their correlation with piecewise functions are they share the same idea of small line segments.
Below is an example:
How to use them?
Piecewise functions are useful because they can show a situation where the graph changes radically and to a point outside of the equations range, as often happens in real life.
Take, for example, when you sell tickets to the opera. If someone wanted to create a strict representation of total revenues earned against number of tickets sold, they would have to use a piecewise graph. Tickets cannot be sold in parts, as only one person will occupy one seat at a time; It would be impractical to sell 1.5 tickets, for example. Because you can't sell portions of a ticket the graph technically cannot be linear, it must have interruptions after each integer. When you are selling tickets to the opera, the rate of change for the graph between whole integers is 0 (each section of the graph between integers is flat). So, each ticket sold would have its own function defining it, specifically in the form of y=Px, x=x
Links
Here are a couple great videos explaining and demonstrating piecewise functions. (http://patrickjmt.com/)
This video gives a great overview of basic piecewise functions and graphing. In general a few examples on how to evaluate piecewise functions with different values of x (ex. f(-4) and f(2)), and than graph them depending on which interval that number is defined.
Finding Domain and Range of Piecewise Functions:
Through this video one can examine a basic look of a piecewise function as well as how to begin interpretation of it. Through domain and range the boundaries of a piecewise function can be seen and the video goes into good detail of how to derive that. The video also introduces the line graph; a much simple method for beginners trying to understand domain and range of a function.
Find the formula for a Piecewise Function from a Graph
This video goes into greater detail of how to interpret a piecewise function graph. The video explains what a hole/discontinuity are and how the reflect when defining the range and domain with respect to the greater/equal to. The video also takes a backward look of interpreting graphs to develop one's own functions and boundaries for what appears to be a piecewise function.
References
1) http://www.mathwords.com/r/removable_discontinuity.htm
2) http://www.brightstorm.com/math/algebra-2/additional-topics/piecewise-functions
4) http://kerbaugh.uncfsu.edu/piecewise/piecewise.html
5)http://mathdemos.gcsu.edu/mathdemos/piecewise/piecewise_differentiability.html


