Course:MATH110/Archive/2010-2011/003/Groups/Group 03/Basic Skills Project
Basic Skills Project - Absolute Value Functions
What are they?
Absolute values are the numerical value of a real number whereby positive and negative signs are disregarded.
An absolute value is represent with a vertical bar on either side of the function:
The definition of an absolute value function follows as:
Therefore the solution of an absolute value is always greater than or equal to zero.
Interestingly the absolute function is equivalent to the square root of , such as in the following case:
,
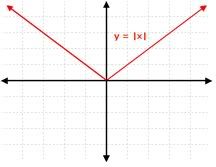
resulting in the 'V' shaped graphs seen below.
Domain & Range
- Domain of absolute value functions is defined with all real numbers
- Range of absolute value functions is on the interval [0,)
Graphing Absolute Value Functions
Taking the absolute value of a negative number makes it positive. For this reason, graphs of absolute value functions tend not to look quite like the graphs of linear functions that we have already studied. Because of how absolute values behave, it is important to include negative inputs in our T-chart when graphing absolute-value functions. If we do not pick x-values that will put negatives inside the absolute value, we usually mislead ourselves as to what the graph is.While absolute-value graphs tend to look like the one above, with an "elbow" in the middle, this is not always the case. However, if you see a graph with an elbow like this, you should expect that the equation is probably an absolute value. In all cases, you should take care that you pick a good range of x-values; three x-values right next to each other will almost certainly not give you anywhere near enough information to draw a valid picture. http://www.youtube.com/watch?v=h2ofpYSBR1c
How to modify Absolute values
The parent graph of an absolute value graph is , which looks like :
But how about a Function like
- When you have a function in the form the graph will move h units to the left.
- When you have a function in the form the graph will move h units to the right.
- When you have a function in the form the graph will move up k units.
- When you have a function in the form the graph will move down k units.
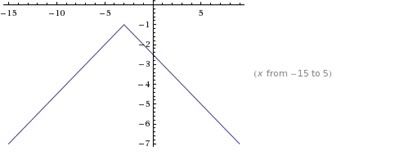
- If you have a negative sign in front of the absolute value, the graph will be reflected, or flipped, over the x-axis.
In this case, when graphing you begin with what is inside the absolute value sign.
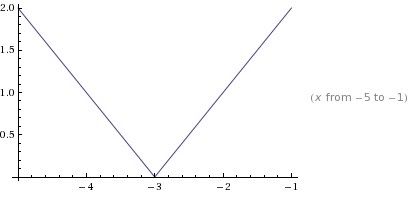
1)You start off with what is inside the absolute value sign.
Shift the graph three units to the left
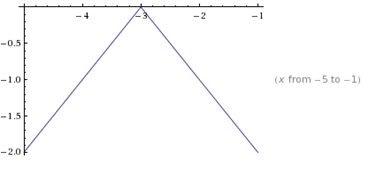
2)The next step is to take care of the coefficient
The negative sign is a reflection on the x axis, and the half is a vertical expansion of 2.
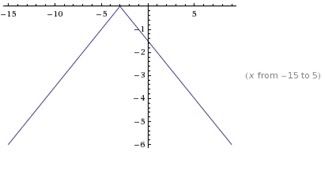
3)The last step is to shift the graph one unit down
How to Use Absolute Value Functions
Simplifying Absolute Value Functions
If then and if then .
Follow the examples below and try to understand each step.
Example 1: Simplify the expressions with absolute value
Solution to Example 1
is positive and according to the definition above can be simplified as follows:
is negative, according to the definition above can be simplified as follows:
is approximately equal to -3.27 which is negative, according to the definition above can be simplified as follows:
) is approximately equal to 4.32 which is positive, according to the definition above can be simplified as follows:
Examples involving algebraic expressions are now presented
Example 2: Simplify the algebraic expressions with absolute value
Solution to Example 2
is always positive and according to the definition above can be simplified as follows:
If , then . According to the definition above can be simplified as follows:
If then and . According to the definition above can be simplified as follows:
|-x + 2 | = - ( - x + 2 )= x – 2
How to Link Them With Piecewise Functions?
In real world situations it can be difficult to describe events with a single smooth function. This is why sometimes we need to use piecewise functions to describe these situations. Piecewise functions are functions that are defined to be smooth functions for specific intervals of the independent variable (most commonly the x-variable).
The link below shows a video which goes over the concept of a piecewise function and provides two problems.
http://www.brightstorm.com/math/algebra-2/additional-topics/piecewise-functions
The Absolute Value Function is a famous Piecewise Function.
It has two pieces:
below zero: -x from 0 onwards: x
![[1]](http://www.mathsisfun.com/sets/images/function-absolute.gif)
f(x) = |x| = x, if x > or equal to 0 f(x) = |x| = -x, if x < 0
Piecewise functions can typically occur in as many regions as possible (often times not more than 2 or 3) but in theory, we could have a piecewise graph that has 20 different regions and it would still be acceptable. So then what we do is graph the function in the region that is respective region that is given.
References
- http://www.vias.org/calculus/01_real_and_hyperreal_numbers_02_14.html
- http://www.tutorvista.com/math/absolute-value-rules