Course:FNH200/Lessons/Lesson 06/Page 06.3
6.3 Thermal Death Curves
When microorganisms (bacteria, such as vegetative cells and spores, moulds, viruses and yeasts) are exposed to high temperatures capable of causing death of the organisms, one observes that the population is not killed instantaneously. We see that microbial death during thermal processing follows a logarithmic order. This means that bacteria are killed by heat at a rate that is nearly proportional to the number present in the system being heated.
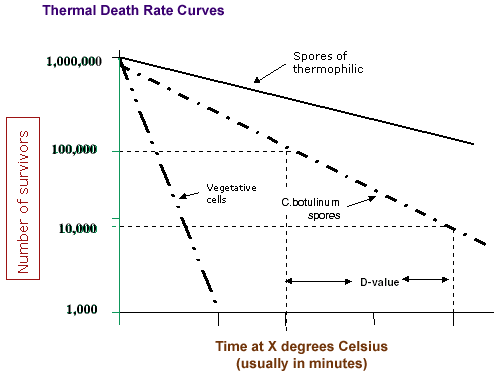
The survivor curve or thermal death rate curve plotted in Figure 6.1 depicts the logarithmic order of death. You will note that the time taken to traverse one logarithmic cycle represents the time, at a constant temperature, required to kill 90% of a microbial population.
The time required to kill 90% of the microbial population exposed to a specific temperature is defined as the decimal reduction time or D-value
A sample calculation of the decimal reduction time follows:
If we were to start out with a population of 105 (=100,000) bacterial cells in a unit volume or mass of food at time 'A', only 104 (=10,000) cells would survive after one logarithmic cycle on the graph was traversed (time 'B'). The reduction in the number of survivors from 100,000 to 10,000 represents a 90% decrease in the number of survivors, as shown below:
- % Reduction in survivors
- = (Survivors at time 'A' - Survivors at time 'B')/Survivors at time 'A' x 100%
- = (100,000 survivors - 10,000 survivors)/100,000 Survivors x 100%
- = 90,000 Survivors / 100,000 Survivors x 100%
- = 90%
Assume that time 'A' is 5 minutes and that time 'B' is 10 minutes. During the time (10-5 = 5 minutes) that the survivor curve traversed one logarithmic cycle, 90% of the microorganisms were killed (10% survived) by the exposure to the constant temperature.
The time taken to kill 90% of the microbial population was 5 minutes. The D-value at that particular temperature was 5 minutes.
Note from the preceding discussion that the D-value is a useful index of the heat resistance of a particular microorganism to the killing effects of heat at a particular temperature. However, also note that D-values apply to a specific microorganism under a specified set of conditions (temperature, type of food).
What effects do different conditions have on the D-value?
- If the temperature is increased, the D-value would decrease because the rate of microbial death would increase.
- The magnitude of the D-value depends on how the constituents of the food affect the sensitivity of the microorganism to the killing effects of heat. The protective effect of food constituents are discussed in more detail later in this lesson.
| Want to learn more? |
| Would increasing the microbial load (in other words, the initial number of microorganisms in the food) increase the decimal reduction time (D-value) of the microorganism at a specified temperature? |
Figure 6.1 is defined as a thermal death rate curve. That is, it describes the rate of death of a particular microorganism under a specified set of conditions. A thermal death time curve (Figure 6.2) can be constructed from a number of thermal death rate curves by exposing the microorganism to a variety of temperatures and determining the decimal reduction time at each temperature.
The thermal death time curve provides information about the time required to kill a particular microorganism in a particular food at a variety of temperatures. Take a close look at Figure 6.2. For example, at a temperature of ~116°C, 10 minutes are required to kill the population of this specific microorganism.
All of the time-temperature combinations along the plotted thermal death time curve represent the same killing power, with lower temperatures requiring longer time of exposure. You should also note that any point above the line (e.g., 100 minutes at ~108°C) will ensure that the microorganism is killed, while time-temperature combinations that fall below the plotted line (e.g., 100 minutes at 104°C) represent conditions that will not kill all of the microorganisms present.
You should also note in Figure 6.2 that vegetative bacteria cells have a much lower heat resistance than spores.
What do the z-values and F-values in Figure 6.2 indicate?
These two terms characterize a thermal death time curve. Potter and Hotchkiss (1995) define the z-value as "the number of degrees required for a specific thermal death time curve to pass through one log cycle".
- Different microorganisms in a given food will have different z-values.
- Similarly, a given microorganism will have different z-values in different foods.
- The z-value indicates the resistance of a microbial population to changing temperature.
The F-value, is a mathematically calculated number that describes the total lethal effects of the process at the slowest heating point in a food container. The standard reference temperature is generally selected as 121.1°C (250 °F), and the relative time (in minutes) required to sterilize any selected organism at 121°C is known as the F-value of that organism.
From Potter and Hotchkiss (1955): the F-value "is the number of minutes at a specific temperature required to destroy a specified number of organisms having a specific z-value".
- The F-value is the equivalent of all heat considered with respect to its capacity to destroy spores or vegetative cells of a particular microorganism. In other words, it is a measure of "lethality" or the capacity of the heat treatment to sterilize.

