Course:CPSC522/Improving Prediction Accuracy of User Cognitive Abilities for User-Adaptive Narrative Visualizations
Title
This project aims to extend a previous study on User-Adaptive Narrative Visualizations by focusing on the user modeling aspect and improving the prediction of user cognitive abilities during Information visualization processing.
Principal Author: Alireza Iranpour
Abstract
Data visualization accompanied by narrative text is often employed to convey complex information in a format known as Magazine Style Narrative Visualization or MSNV. However, simultaneous processing of two disparate information sources, namely visual and textual information, can be somewhat challenging as attention will be split. Recent studies show that these difficulties depend on the reader’s level of cognitive abilities. As a result, predicting user cognitive skills can discover individual struggles and enable tailored support. This project would be an extension of a previous study on this subject wherein eye-tracking data were leveraged to predict user’s cognitive abilities with the ultimate goal of providing personalized support with information visualization processing.
Builds on
Information Visualization, User-Adaptive Narrative Visualizations.
Related Pages
Information Visualization, User-Adaptive Narrative Visualizations[1], Eye-tracking, Machine Learning, Bayesian optimization, ANOVA, .
Content
Previous work[2]
Motivations
People with different cognitive abilities have different performance in processing different aspects of Information visualization. Hence, learning the level of each user’s cognitive abilities can greatly empower personalized support. Given the perceptual nature of processing Information visualizations, eye movement patterns can reveal a good deal about user cognitive states and, therefore, can be leveraged to predict user cognitive abilities.
Three cognitive abilities, namely reading proficiency (READP), visualization literacy (VISLIT), and verbal working memory (VERWM), have been used to identify how adaptation needs to be performed.
Each cognitive ability determines the level of proficiency in processing particular aspects of narrative visualizations. Verbal working memory indicates ability in maintaining verbal information, so people with a low level of this ability might benefit from simplification of the text. Visualization literacy, on the other hand, refers to the degree to which one can efficiently and confidently perceive data visualization, so people with low levels of this trait would appreciate visual cues that link corresponding elements between the text and the visualization. Last but not least, reading proficiency is the ability of processing labels and data points, so additional guidance would benefit those who are not proficient readers.
Approach
To gain insight into how eye movement patterns relate to cognitive abilities, a study was conducted with 56 subjects wherein participants were asked to read 15 MSNV documents and, after each, respond to 3 comprehension questions. The cognitive skills of each subject were also evaluated and scored in advance through a battery of well-established psychological tests. During the study, as participants read these documents, their eye movement patterns were tracked using a T120 remote eye-tracker. These raw data were then processed and represented in terms of the following features over 7 salient regions in the MSNV known as areas of interest (AOIs):
- Gaze features: fixations (rate and duration) and saccades (duration, distance, and velocity)
- Pupil and head distance features: pupil size (width and dilation velocity) and head to display distance
The results from the study including eye-tracking data and cognitive ability scores were then used as training data to train classification models that classified cognitive abilities of each user into high and low based on their eye-movement data.
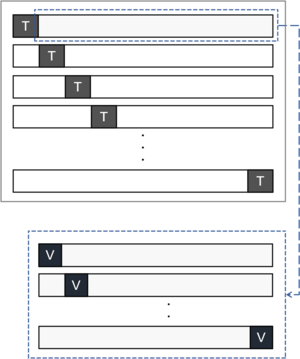
Since user information can be logged from several interaction sessions, the usefulness of prior user data was examined by having the classification model make predictions at the end of each task based on the accumulated data from all the previous and the current task. This was done by producing the same features for each subject considering all eye-tracking data collected up to the current task rather than the current task alone (e.g. compute fixation rate over all previous tasks and not just over the current tasks). This accumulation of eye-tracking data resulted in 15 windows (i.e. the first window (window 1) computed features over task 1 while the last window (window 15) computed the same features over all 15 tasks). All windows had the same amount of data (examples). The data from previous tasks were simply reflected in the feature values of each window.
For each cognitive ability, the study compared the following classification algorithms against a majority-class baseline:
- Logic Regression (LR)
- Random Forest (RF)
- Support Vector Machine (SVM)
- Extreme Gradient Boosting (XGB)
The performance of each model was evaluated in terms of accuracy using a 10 times repeated 10-fold cross validation over users (10 by 10 CV). The results are as follows:
| Cognitive Ability | Ranking of Classifiers | Accuracy at Best Window | ||
|---|---|---|---|---|
| Window | Accuracy | Base | ||
| READP | RF > SVM > XGB > LR > Base | Task 4 | 0.67 | 0.51 |
| VISLIT | RF = SVM > XGB = Base > LR | Task 3 | 0.66 | 0.53 |
| VERWM | XGB > RF > LR > SVM > Base | Task 10 | 0.72 | 0.51 |
Extension
Motivations
In the study, to avoid complexity, only 4 classification algorithms have been explored and evaluated. However, there may be other classifiers that can achieve higher accuracies. Moreover, these classifiers were assessed at their default configuration without any special feature selection or feature preprocessing. Therefore, they may not have reached and demonstrated their full potential. In fact, the main purpose of the study was to establish the feasibility of predicting cognitive abilities based on eye-tracking data. As a result, not enough effort was put into fine-tuning the employed classifiers or exploring alternative ones. In this project, we will investigate the effect of feature preprocessing and feature selection on classification performance and whether optimizing the hyper-parameters would result in improved accuracy. Particularly, we will test the following hypotheses:
- H1. Preprocessing and selection of features would improve classification accuracy
- H2. Hyper-parameter optimization would improve classification accuracy
Considerations
The original dataset for each window contains 278 features and 53 samples (3 of the 56 subjects were removed due to incomplete data). Due to the small number of examples in each dataset, instead of following the evaluation method used in the study (repeated 10-fold CV), we will employ a leave-one-out cross validation as it completely eliminates the randomness associated with data partitioning and more importantly would leave more samples for training in each iteration.
In addition to the classification models assessed in the study, we will also evaluate gradient boosting and nearest neighbors (non-parametric model).
As a result of bootstrapping and random feature consideration, ensemble models, namely RF, GB, and XGB, would yield different results in each run. Therefore, to strengthen the stability of our evaluation, for these models, we will repeat the leave-one-out cross validation 10 times and report the average over the 10 runs.
Feature selection
In each of the 53 (number of samples) iterations of the leave-one-out cross validation, all of the features are scaled and normalized based on the samples in the training portion. Subsequently, analysis of variance (ANOVA) is performed on the transformed features and those with the highest F-value score are selected. Normalization of the features is specifically intended to improve the performance of the models that use Euclidean distance as part of their algorithm and also expedite the convergence of gradient descent.
In our feature selection approach, the normalized samples inside the training portion are grouped based on their target value (low or high). Then, for each feature, the F-value is calculated as the between-groups variance divided by the within group variance. In simple words, we measure the significance of the difference between the means of the two classes for each feature. Features with more significant differences (higher F-value scores) are selected as more predictive. These features are then considered for making predictions in the evaluation phase while the rest (features that did not demonstrate a significant difference) are simply disregarded (i.e. removed). Given the relatively large number of features compared to the number of samples, feature selection (i.e. keeping only a subset of the features) was intended to mitigate overfitting and improve generalizability.
Note that this is performed in addition and prior to the inherent feature selection mechanisms in some of our models (e.g. L1 regularization in Logistic Regression)
Hyper-parameter optimization[3]

In order to assess the effectiveness of hyper-parameter optimization, a nested cross validation approach is adopted. In the outer loop of the structure, a leave-one-out cross validations is applied on the dataset. Within each iteration of the outer cross validation, in addition to the previously mentioned preprocessing and feature selection, the hyper-parameters of each model are optimized based on a second level of cross-validation (inner loop) on the split training portion. The optimized model is then retrained on the entire training portion and tested on the held out sample from the outer loop. The inner loop is used for tuning, and the outer loop is meant for evaluation.
The task of finding optimal hyper-parameter values is treated as a Bayesian optimization problem. Unlike the randomized search approach, Bayesian optimization uses past evaluation results to choose the next best candidate values. In our case, the objective function is the cross validation error. In the Bayesian approach, instead of directly optimizing the objective function, which is intractably expensive, a probability model also known as a surrogate function is built based on the previous evaluation results (of the objective function) to enable effective exploration of the search space while restricting poor choices. For each hyper-parameter, we use a bounded distribution of possible values from which to sample (the default values are also included in the distributions).
This approach can be outlined as the following:
- Compute a posterior expectation of the objective function using the previously evaluated values.
- The posterior is an approximation of the unknown objective function and is used to estimate the cost (cross validation error) of different candidate values that we may want to evaluate.
- Optimize the conditional probability of values in the search space to generate the next candidate value
- Evaluate the value with the objective function (cross validate the model using the value for the hyper-parameter)
- Update the data and the probability model
- Repeat
This process can be repeated until a good enough result has been found or resources are depleted. In this project, each model was optimized up to 10 iterations.
Cognitive abilities
First, we evaluate the accuracy of our models over the 15 windows without manipulating any of the features or the default hyper-parameter configurations. The same evaluation process is also performed on the preprocessed and selected features. Finally, for each classifier, the best window (window with the highest accuracy) is used for tuning the hyper-parameters. The results are as follows:
Reading proficiency
 |
 |
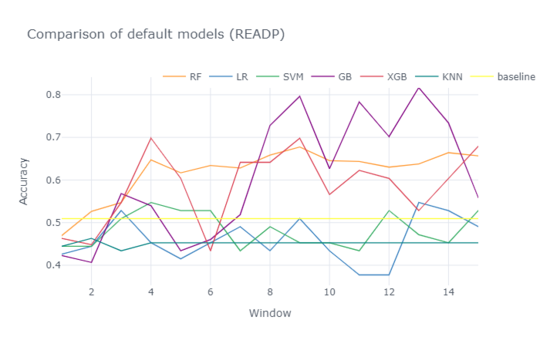
In the original study, for reading proficiency, the best accuracy was achieved at the fourth window by RF (0.67). However, according to our results, XGB was able to achieve 0.7 at the same window (Figure 1). The difference in the results could be explained by the difference in the evaluation method or implementation of the classifiers. The previous study used the Caret package (Kuhn 2008) in R. In this project, however, we used the scikit-learn library in python. Although, we were able to achieve an even higher accuracy at the same window, the gradient boosting classifier (GB) attained a significantly higher accuracy at window 13 (0.82). The rest of the classifiers (non-ensemble models) demonstrated close to baseline performance on the original data. In Figure 2, we can see that preprocessing and feature selection significantly improved the performance of these models. The SVM classifier provides an accuracy of 0.65 early on in the second window. At the fifth window, SVM and LR achieved accuracies of 0.77 and 0.75, respectively. Logistic Regression has the advantage of high interpretability which enables explainablility. As expected, feature selection did not prove effective for the ensemble models.
The hyper-parameters of each classifier were tuned at the best window. The results are as follows:
| Classifier | Window | Default | Tuned |
|---|---|---|---|
| RF | 4 | 0.68 | 0.68 |
| LR | 5 | 0.75 | 0.75 |
| SVM | 5 | 0.77 | 0.77 |
| GB | 11 | 0.82 | 0.68 |
| XGB | 9 | 0.70 | 0.74 |
| KNN | 7 | 0.68 | 0.62 |
Contrary to our expectation, tuning the hyper-parameters resulted in reduced accuracy for the majority of the models. For XGB, however, there was a noticeable improvement. In order to determine the statistical significance of this improvement, an independent samples t-test was conducted over 10 runs. The results are as follows:
| Overall | Low class | High class | |
| XGB | p = 0.005 | p = 0.065 | p = 0.008 |
The result show evidence for a statistically significant improvement in the overall accuracy and the accuracy of the high class (p < .05). For the low class, however, we have weak evidence for a significant improvement.
Visual literacy
 |
 |
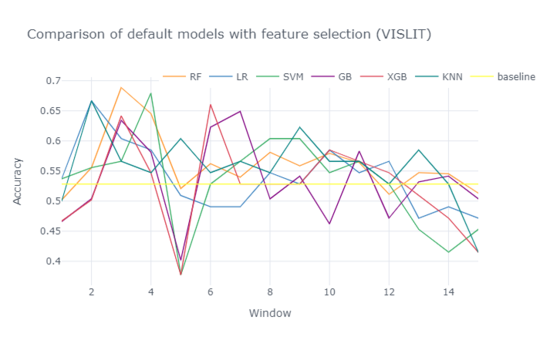
According to the study, RF was also the best classifier for visual literacy yielding an accuracy of 0.66 at window 3. However, not only did GB reach a higher accuracy at this window, but it also attained 0.72 at window 14 (Figure 3). KNN had a terrible performance on the original data, but after preprocessing and feature selection, this classifier provided an accuracy of 0.67 at window 2 (Figure 4).
The results of hyper-parameter tuning are as follows:
| Classifier | Window | Default | Tuned |
|---|---|---|---|
| RF | 3 | 0.69 | 0.75 |
| LR | 2 | 0.67 | 0.67 |
| SVM | 4 | 0.68 | 0.51 |
| GB | 7 | 0.65 | 0.57 |
| XGB | 6 | 0.66 | 0.68 |
| KNN | 2 | 0.67 | 0.67 |
RF and XGB were the only classifiers with improved accuracy. Once again, a t-test was conducted to determine the significance of these improvements.
| Overall | Low class | High class | |
| RF | p = 0.008 | p = 0.023 | p = 0.158 |
| XGB | p = 0.015 | p = 0.151 | p = 0.004 |
As we can see, the overall improvement was significant for both classifiers. For RF, the improvement was significant for the low class. As for XGB, however, it was the high class which was significantly improved.
Verbal working memory
 |
 |
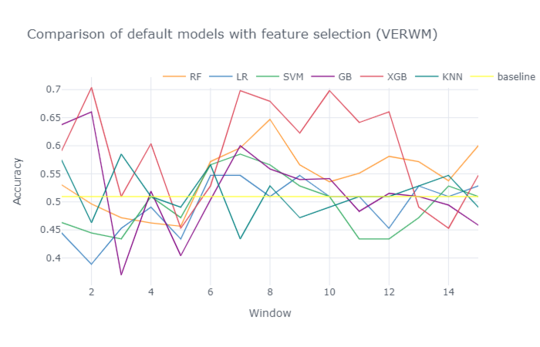
Lastly, for verbal working memory, the highest reported accuracy was 0.72 at window 10 achieved by XGB. Once again, GB proved to be the best model yielding an accuracy of 0.79 even earlier at window 7 (Figure 5). Preprocessing and feature selection was most effective for XGB and improved its accuracy to 0.7 at window 2 (Figure 6).
The results of hyper-parameter tuning are as follows:
| Classifier | Window | Default | Tuned |
|---|---|---|---|
| RF | 8 | 0.65 | 0.60 |
| LR | 6 | 0.55 | 0.45 |
| SVM | 7 | 0.58 | 0.57 |
| GB | 2 | 0.66 | 0.61 |
| XGB | 2 | 0.70 | 0.70 |
| KNN | 3 | 0.58 | 0.53 |
For this cognitive ability, optimization of hyper-parameters did not lead to improved accuracy for any of the classifiers.
Discussion
According to our results, feature preprocessing and feature selection improved classification accuracy in most classifiers especially the non-ensemble models (i.e LR, SVM, KNN). As a result, we can accept our first hypothesis.
H1. Preprocessing and selection of features would improve classification accuracy (Accepted)
Optimization of hyper-parameters, on the other hand, although effective for some models, mostly resulted in lowered accuracy. Therefore, our second hypothesis is rejected.
H2. Hyper-parameter optimization would improve classification accuracy (Rejected)
Interestingly, as also demonstrated in the previous work, including data from additional tasks (later windows) appeared to have a negative effect on the prediction accuracy for some cognitive abilities. That is for some cognitive abilities (also dependent on the model), optimal results are found after accumulating eye-tracking data over few tasks. Seemingly, accumulation of further eye-tracking data, at a certain point, is more disruptive than helpful. Perhaps, other abilities start to interfere. As a result, eye movements become less indicative of the cognitive abilities in question. In this regard, in addition to investigating potential models, we also compared the results at different windows to find the optimal amount of eye-tracking data for each cognitive ability depending on the model.
Future work
In this project, the hyper-parameters of each model were tuned based on the window on which the model performed best with the default configuration. In that regard, It would be interesting to try the other windows as well.
Annotated Bibliography
- ↑ Ben Steichen, Giuseppe Carenini, Cristina Conati. User-Adaptive Information Visualization - Using Eye Gaze Data to Infer Visualization Tasks and User Cognitive Abilities
- ↑ Under Preparation, Eye-Tracking to Predict User Cognitive Abilities and Performance for User-Adaptive Narrative Visualizations, AAAI 2020 Sept 5
- ↑ Feurer M, Springenberg JT, Hutter F. Initializing bayesian hyperparameter optimization via meta-learning. InTwenty-Ninth AAAI Conference on Artificial Intelligence 2015 Feb 16.
To Add
|
|
