Course:CPSC522/Graph Based keyword extraction
Centrality Ranking Based Corporate Network Analysis And Top-K Corporation Extraction
We extracted a corporate network in which nodes represent firms and edges represent board interlocks (shared board members) between two firms, and use centrality methods to analyze corporate importance to see if we can rebuilt the corporate ranking comparing to profit ranking.
Note: Sorry about the change of title, the method in this page is the same as the one with previous title, just modified the title to a more detailed description.
Principal Author: Jiahong Chen
Abstract
During the past two decades, globalization has led to a world-wide economy, which has been extensively studied by economists as well as researchers from the fields of public administration and social sciences. A relatively new way of looking at global economic activity, is by modelling it as a network (or graph) consisting of companies (nodes) and particular relationships (edges) between these companies. The relationships between companies can be defined in many ways, for example based on company ownership, resulting in a network in which two firms are linked if one firm owns a certain percentage of another firm [1]. Usually, corporates are ranked according to their profit, size or stock value. But few people studied how the correlation among corporations makes them distinguished. In this way, we regard corporate network analysis as a social network problem, and tried to use social network analysis methods (graph based centrality) to figure out how the centrality ranking of the corporate network is related to their profit ranking. The hypothesis is how centrality rankings will affect the rankings of corporates and how noises in low ranking firms will affect the accuracy of centrality ranking results. We will test this hypothesis that by using different top-K corporation choosing strategy and compare the results to the corporation's profit ranking list. And we will give the suggestions about how to choose top-K corporations from a large dataset to decrease the noise.
Builds on
Graph-based corporate extraction builds on graph theory, Graph-based centrality methods, Text Mining and artificial intelligence to understand the information corporate's activity.
Related Pages
It is a artificial intelligence and data mining problem relating to Text Mining, Information Retrieval.
Content
Introduction
In this project, we are interested in the situation that large corporations often have overlapping board members or directors, which are called board interlocks. This allows a large global network of corporations to be constructed, where a node stands for a company and links between nodes stand for links between companies. For example, the supervisory board of Microsoft and Apple share board members, so there is an edge between these two companies in the corporate network. We use unweighted graph here to describe the corporation network, which means the weight of links between companies are all the same. We value the weighted graph as important as unweighted graph, they should be equally tested. However, due to the limitation of time, we only implemented unweighted graph.
In this way, we apply centrality methods to analyzing companies' ranking under different national scale data set, for comparing the centrality ranking results' correlation towards their profit ranking. However, simply applying centrality methods makes quite low correlation towards profit ranking because the noise in the tail of the data set[2]. One important aspect is that the tail of the data might contains a lot of noise because of their specific holding structures. Therefore, if we choose the full data set to analyze, those noise companies many make the result of centrality methods inaccurate.
In this way, we apply two different top-K company choosing strategies to decide how large the data set should choose. One of them is choosing top-K companies directly by theirs profit ranking and re-rank them with the help of centrality methods. Another one is choosing top-k companies at first, and apply different centrality methods on them. And then choose top-K companies from those centrality method results, where k should be larger than K.
Related Work
Graphs
In graph theory, graphs are a set of nodes, where some pairs of them are connected by edges [3]. Here are some notations of graphs shown in Table 1.
| Concept | Symbol |
|---|---|
| Graph | G=(V,E) |
| Objects(nodes) | V |
| Relations(edges) | E |
| Number of nodes | |
| Number of edges |
Some notation examples are shown as follow and figure 1:
- Graph Notation Examples
- Undirected Graph
- Nodes
- Edges
- Number of nodes:
- Number of edge: (counting undirected edges)
- Or: (counting (symmetric) directed links)

Further, different graph types could be defined:
- Directed and Undirected graphs
- Links in directed graphs have direction, so the link from A to B is different from the link B to A (with )
- item in Undirected graphs, the link from A to B has the same meaning with the link from B to A, they both mean that Node A links to Node B.
- Weighted and unweighted graphs
- In unweighted graphs, we usually weight links to 1 for computational reasons
- In weighted graphs, the weight should be rational numbers and integers. And in some cases, like the situation in TSP problem, it should be positive values.
- In signed networks the weight could be positive and negative
- One-mode (homogenic) and two-mode or multi-model networks[4]
- One mode network, is the most common large-scale networks. Nodes are connected to each other directly by edges.
- Nodes in two mode or multi-mode network will have more than one set of nodes, and ties existing only between nodes belonging to different sets.
Two-mode network and one-mode network
The comparison of one-mode network and two-mode networks is showed as figure 2, the left one is the one-mode network and the other is two-mode network. Let nodes in the circle {u,w,v,x,y,z} be the companies, and the nodes in the triangle {A,B,C,D,E,F} be the shared board members. Thus, the difference between one-mode network and two-mode network is that companies are not directly linked to each other by (company - company) pairs, they are linked by (company - board member) pairs.

The two-mode network often need to be transformed to one-mode network because most network analyze measures are designed for one-mode network, and it is not appropriate for analyzing two-mode network [5] [6]. The method for this transforming is named projection, the function of this method is that it will select one node from two-mode network as the beginning, and then, link this node to the other one if they share at least one common node in the same two-mode network set. As shown in Figure 2, a two mode network (right one) is projected into a one mode network (left one). As we only discuss the situation of undirected graphs in this paper, we will allocate weights to the edges in this one-mode network as the number of common nodes if the network should be weighted [7].
Graph-based methods
In graph theory and network analysis, centrality identifies the importance of nodes within graphs [8]. In this project, we are about to utilize centrality methods, which is one of graph-based methods, to calculate the importance of nodes, which is actually words, in the graph, and rank them according to their centrality importance to select top-K important words as keywords.
Degree Centrality
Degree centrality is a method that is used in graphs to measure the number of adjacent nodes. This method consist of indegree centrality and out centrality in directed graphs, which calculates them separately. The equation for degree centrality is listed as below:
Where n means the amount of nodes, deg(v) is the degree of point v, and it will be the in-degree and out-degree if it is a directed graph. As shown in the equation, this method only focus on local centrality and only calculate the nodes that directly connects to the original one. But this also ensures the measure has a very high performance in computation, it requires only O(1) computing time for each node and O(n) for the whole data set if we use adjacency list to store data.


The distribution of degree centrality is showed as the figure 2 and figure 3, from which we can find out that when the degree is low, there are not so many distinct values. This indicates the the importance of high centrality nodes:
Closeness Centrality
Closeness centrality is another centrality method. It calculates a nodes' average distance to each other node in the graph, and it is a global distance-based measure which calculates the connected points. So it requires higher computing time than the degree centrality method. It requires O(m) for each node to carry out BFS method, and O(mn) for the whole data set, where m is the sum of degrees in each node and n is the amount of nodes [9] [10]. Let the Graph G=(V,E) with |V| Nodes, and |E|edges, the equation of the Closeness centrality is listed as below:
where w is any nodes which except v in the graph G, d(v,v)=0 and n means the amount of nodes. In this way, a node has higher centrality in this method will have a lower total distance to all the other points, and it means this node is the more easily accessible node for other nodes in this graph. But this will also make this method not suitable for some real-world cases. For example, it is not suitable for corporate network analysis, because important and big companies may not have direct links to some small companies in the graph, and the distance between them may be bigger than expected. And it is hard to define how much the value should a company have to be decide to be important ones.
Betweenneess Centrality
Betweenness centrality measures the number of shortest paths that run through a node, it is equal to the number of shortest paths from all vertices to all others that pass through that node[11] and Nodes with higher Betweenness centrality value will have larger importance in the graph. It is a global path-based measure. So it also requires higher computing time than the degree centrality method. It requires O(2m) for each node to carry out BFS method for two times, and thus O(2mn) for the whole data set, where m is the sum of degrees in each node and n is the amount of nodes.
Let the Graph G=(V,E) with |V| Nodes, and |E| edges, the equation of the Closeness centrality is listed as below:
where is the number of shortest paths from v to w, is the number of such shortest paths that run through u. And Then the equation could be normalize to [0,1] by divide this largest value.
PageRank
PageRank is an method used by Google Search to rank websites, it is named after Larry Page, one of the founders of Google [12]. This method works by counting the number and quality of links to a page to determine a rough estimate of how important the website is. The underlying assumption is that more important websites are likely to receive more links from other websites.
As web graph is also a kind of graph, PageRank could also provides the importance of each node when we consider the nodes in the graph as websites. In this way, by considering words of an article as the websites, PageRank are able to calculate the centrality importance of each word.
The equation of PageRank is listed as below:
Where d is damping factor, is the webpage under consideration, is the set of pages that link to ,N is the amount of webpages, and is the number of outbound links on page . A damping factor is needed for assuming that people will continue to click to next page by damping factor probability. And damping factor is usually set at 0.85 after several studies and tests [13].
Pearson product-moment correlation coefficient
Pearson product-moment correlation coefficient is a method of the linear correlation between two variables X and Y. This method will give out a value between +1 and -1, where 1 means total positive correlation, 0 for no correlation, and -1 for total negative correlation. It is a widely used scientific method to decide linear dependence between two variables. It was developed by Karl Pearson from a related idea introduced by Francis Galton in the 1880s [14] [15].
The result of Pearson's correlation coefficient could be presented as r. If we have one data set X and the values in it are which containing n values and another one names Y, containing n values , equation is listed as below:
where:
There is another form to present this equation, the definition for n, , , , are the same as the former one:
where:
Besides, rearranging gives us this equation for r:
This formula suggests a convenient single-pass method for calculating sample correlations, but, depending on the numbers involved, it can sometimes be numerically unstable. Rearranging this equation again, we could have the equation below:
Dataset
Total link of the row data is 3424120, and the total companies of this dataset is 968,409, and it is a two mode network data. In order to better analyze the whole data set, we generated a perl script to extract data from two mode network into one mode network. After using this script to extracts two mode network into one mode network, the number of the company dropped from 968,409 to 391,992, this is because there are many companies who did not share board members with other companies and they will not be included in the new data set.
After the global data set has been established, we extracted 10 countries' company in order to better test the performance of different centrality method under different scale. We chose Canada, China, Germany, France, Great Britain, India, Italy, Japan, Russia, the U.S.A. as the national scale data set because 8 of them are Group 8 countries, and 2 of them are the two largest developing countries. G8 is a governmental forum of leading advanced economies in the world [16], 8 countries are both industrialized and developed countries, they are the most wealthiest developed countries on earth evaluated by both national net wealth and by GDP [17]. They also composed 50.1 percent of 2012 global nominal GDP and 40.9 percent of global GDP (PPP) in 2012. As for China and India, They both have the largest popularity on earth, more than 1.2 billion. And China is second largest national economy with a GDP of approximately $10,380,380 millions while India is 10th with a GDP of approximately $2,047,811 millions [18] The details of all the companies in different countries' corporate network is listed as below:
| Country | Nodes (Companies) | Average Clustering Coefficient | Average Degree | Diameter | Average Path length | Edges |
|---|---|---|---|---|---|---|
| Canada | 9426 | 0.588 | 5.244 | 14 | 5.20 | 49426 |
| China | 2612 | 0.696 | 2.518 | 14 | 5.77 | 6576 |
| Germany | 29234 | 0.854 | 5.037 | 25 | 8.14 | 147252 |
| France | 22056 | 0.816 | 4.921 | 16 | 6.12 | 108546 |
| Great Britain | 55863 | 0.856 | 14.93 | 21 | 6.62 | 834280 |
| India | 6479 | 0.545 | 9.428 | 15 | 4.72 | 61082 |
| Italy | 16300 | 0.797 | 3.096 | 23 | 7.55 | 50468 |
| Japan | 14440 | 0.762 | 1.884 | 20 | 7.18 | 27202 |
| Russia | 8709 | 0.735 | 3.933 | 23 | 6.56 | 34256 |
| U.S.A. | 49671 | 0.61 | 3.739 | 24 | 6.70 | 185736 |
Examining Hypothesis
In this project we would like to examine the impact of deleting different amounts of noise in the tail of the dataset when using centrality rankings and different top-K corporation selection strategy. And finally give the suggestion for choosing correct top-K corporations to reduce noise.
Methodology
One important aspect is that we know that the tail of the data contains a lot of noise, so we want to find out that should we analyze all the companies in general, or just the top-200k or top-100k companies based on profit ranking. And we also want to find out that what happens when we consider just the top-K companies, and decide whether there is a positive correlation between profit ranking and centrality measures. We used two strategy to extract top-K companies.
- First strategy is that we only extract top-K companies according to their profit ranking. Then, we will re-rank these companies by applying centrality methods.
- Second strategy is that we will extract top-K companies based on the centrality method results generated from k scale data set, where k scale data set is extracted from full data set by their profit ranking and k should be bigger than K. The meaning of this strategy is that we could ensure that the the desired K companies are driven from the a suitable dataset which deleted noises in the tail and have a scale of k. In another words, first strategy is one kind of second strategy when K equals to k.
In this way, the architecture of using two top-K corporation extracting strategy is shown as figure 4:
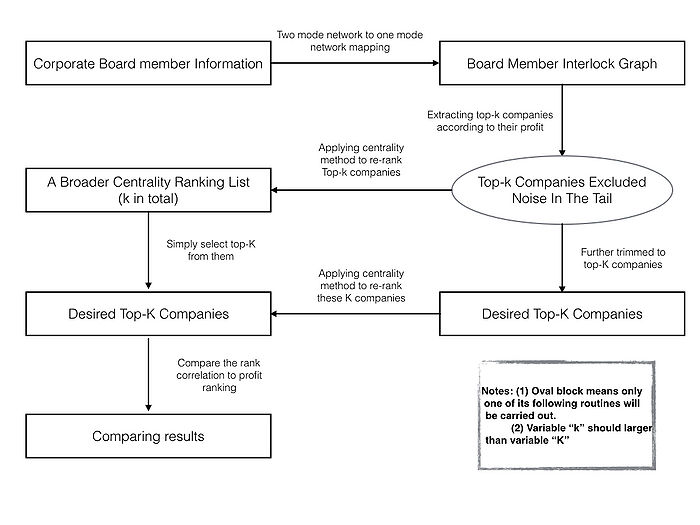
In order to extract top-K important companies according their centrality importance, following steps should be carried. First, the board member information is convert to board member interlock graph by converting two mode network into one mode network. Then we will firstly extra top-k companies from the whole dataset according their profit, where k should significantly larger then K to satisfy conditions of strategy two. Next, different top-K selecting strategies are applied to generate the top-K company ranking list. Last, ranking lists will be compared to profit ranking list to exam if they have positive correlation by using Pearson's correlation coefficient.
The distribution of different Top-K companies are listed as below:
| Scale | Nodes | Average Clustering Coefficient | Average Degree | Diameter | Average Path length | edges |
|---|---|---|---|---|---|---|
| Top100 | 51 | 0.405 | 2.392 | 8 | 3.39 | 122 |
| Top1000 | 719 | 0.307 | 4.743 | 15 | 4.99 | 3410 |
| Top10000 | 6972 | 0.447 | 5.489 | 18 | 5.81 | 37278 |
| Top50000 | 29844 | 0.538 | 5.212 | 22 | 6.54 | 155560 |
| Top100000 | 29844 | 0.586 | 5.072 | 23 | 6.89 | 278206 |
Results of Strategy One
In this stage, we will compare different ranking results by Spearman's rank correlation coefficient, which is defined as the Pearson correlation coefficient between the ranked variables, under different top-K data set selected according to their global profit ranking. Figure 4 presents the results of this and group them by different data set scale. As we can see, the comparison between centrality methods usually have the same performance under different data set scale. Results of betweenness centrality method and degree centrality method pair, betweenness centrality method and PageRank method pair, degree centrality method pair and PageRank method pair have the best performance under different data set scale, which shows results of these three centrality methods will have best correlation, and rankings provided by them will have the most similarity under different data set scale. This may also indicate that these three method could best describe the importance of this kind of network's node.
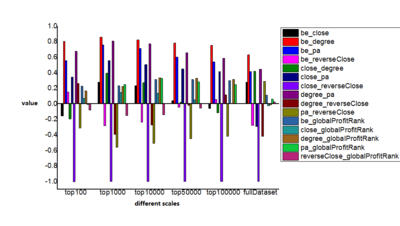
Besides, if we look further into the comparison between centrality methods and profit ranking under different data set scale, we can find out that results relation to profit rankings will go up to a considerable amount at some special data set scale. Figure 5 presents that if we use full dataset, there will be little correlation between different centrality methods and profit ranking, the result of Spearman's correlation coefficient will no more than 0.1 , which means rank lists have low correlation. But, if we only pick top-10000, top-50000 or top-100000 companies, who occupies around 2.5%, 12.5% and 25% of full data set, the result of betweenness centrality method, degree centrality method and PageRank method will show good correlation to profit ranking. This indicates that the tail of the full data set (low profit ranking companies) contains a lot of noise, and their holding structure will confuse the centrality methods, and let them make wrong decisions. In this way, we can say that, after deleting noise points in the full data set, betweenness centrality method, degree centrality method and PageRank method are able to present companies importance in profit ranking. As for results generated by top-100 and top-1000 data set does not also show good correlation, it is because too small data set(only 0.025% and 0.025% of full data set) will provide a very small sample size, and make ranks easily uncorrelated.

It is easy to find out a interesting situation that the correlation value goes up as the data set scale increases at first, and then it will decrease until data set scale goes up to full data set. We want to look further into this, use more data set scale to try to find out the value vary trend, and decide how big data set should we use to apply centrality methods to detect different companies's importance that best fits profit ranking. We added top-25000, top-75000, top-150000, top-200000, top-250000, top-300000 , top-350000 dataset, and apply betweenness centrality method, degree centrality method, PageRank method on them. We only apply these three centrality method because the low value of closeness centrality method and its reverse result has already shown that they are impropriate for detecting companies' importance that fits profit ranking. The result is presented in the figure 6 at below:
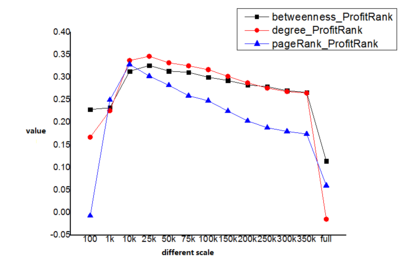
As we can see, all these three method get their highest correlation with profit ranking at around 25000 scale data set. This might indicates that if we pick around top-10000 to top-30000 from full data set, we can apply these three centrality methods to analyze corporate network. Besides, this also presents that there are many noise in the tail of the data set, if we want to analyze corporate network in the most clear way, we should remove those low profit ranking companies. Moreover, PageRank method only can get considerable correlated result at around top-10000 data set, but the betweenness centrality method and degree centrality method are able to function well from top-10000 data set to top 200000 data set, this shows that these two method will have a better adaptability when analyzing corporate network.
To conclude, there are many noise nodes in the tail of the full data set which will make centrality methods' results have low correlation with profit ranking under full data set. If we use top-25000 data set which generated from full dataset, we can best ignoring noise companies and make centrality methods have best correlation with profit ranking.
Results of Strategy Two
In this stage, we will compare different centrality method results generated by different scale of data set to profit ranking by their similarity. The following figures are generated according to different k scale data set.
Figure 7 describes results between centrality methods and profit ranking in Top-10000 Companies. The A, B, C, D, E, F, G, H in the horizon axis means the profit ranking is compared to betweenness centrality method results in top-10000 companies generated from 100000 scale data set, betweenness centrality method results in top-10000 companies generated from full data set, closeness centrality method results in top-10000 companies generated from 100000 scale data set, closeness centrality method results in top-10000 companies generated from full data set, degree centrality method results in top-10000 companies generated from 100000 scale data set, degree centrality method results in top-10000 companies generated from full data set, PageRank method results in top-10000 companies generated from 100000 scale data set, PageRank method results in top-10000 companies generated from full data set separately.
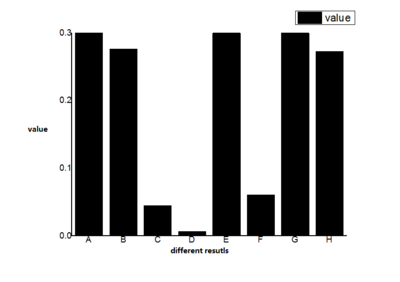
In this figure, none of considerable similarity results appears in cases relating to closeness centrality method or under data set extracted from full data set. Then, if we increase the scale of data set further, choose top-50000 companies, we could get figure 8. In this figure, the A, B, C, D, E, F, G, H in the horizon axis means the profit ranking is compared to betweenness centrality method results in top-50000 companies generated from 100000 scale data set, betweenness centrality method results in top-50000 companies generated from full data set, closeness centrality method results in top-50000 companies generated from 100000 scale data set, closeness centrality method results in top-50000 companies generated from full data set, degree centrality method results in top-50000 companies generated from 100000 scale data set, degree centrality method results in top-50000 companies generated from full data set, PageRank method results in top-50000 companies generated from 100000 scale data set, PageRank method results in top-50000 companies generated from full data set separately.
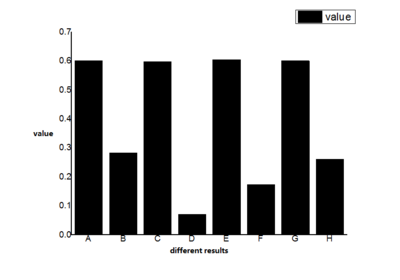
we could find out that results from all four centrality methods and generated from 100000 scale data set has considerable similarity with profit ranking, whose value is around 0.6. This means more than 60% companies are the same in these results and profit ranking. An interesting finding is that closeness centrality method also showed good similarity with profit ranking, but this does not means the high correlation between them. Because the scale of data set has grown up to 50000, is too big for us to consider all the companies have the same importance.
To conclude, we could find out that betweenness centrality method and PageRank method performs best under different scale of data set; there are many noise in the tail of full data set and it will confuse centrality methods and make results not accurate.
Conclusion
We extracted Top-K companies by two strategy: a) directly extracting them by profit ranking and re-ranking them by centrality methods, and b) extracting them from centrality method results, to test whether there are noises exists in the tail of the data set. The result shows when choosing Top-25000 companies from full data set, betweenness centrality method, PageRank method and degree centrality method will show best correlation to profit ranking, which means there are noises exists in the tail of data set.
Further more, results of first strategy indicates that, there are many noises in the tail of the profit ranking list that make them do not have much correlation to the centrality ranking. By selecting suitable subgroup of the whole dataset according to their profit ranking, centrality methods could give another view on the companies's importance with regard to profit ranking. As for the second strategy, we can get similar conclusions. Top-K rankings generated from suitable larger k scale datasets receives higher accuracy than generated from the whole dataset.
Case Study On China's Corporate Network
Given above conclusions, a case study is given to exam the performance of centrality ranking results. As a native Chinese, I would like to exam part of rankings that generated by centrality methods to view their correctness. The description for the dataset is shown in table 2.
Most "Important" Company In China
Cn Bank of East Asia (CBEA) is said to be the most "important" company and it has many board member interlocks with Hong Kong companies. These companies that CBEA relate to are actually very big companies which are listed on the Hong Kong Stock Exchange and have great impact on the whole Hong Kong's economy. For example, Sun Hung Kai Properties and The Wharf Limited are biggest real estate companies and ranked top 10 in Hong Kong Stock Exchange. And Hong Kong-based Hutchison Whampoa Ltd. is owned by Ka-shing Li, the richest Chinese people over the past decades. So, although this company may not have such impact on mainland of China, it is reasonable to be selected as the most "important" one when counting in Hong Kong Special Administrative Region.
Other "Important" Companies
Dark green and brown nodes in figure 9 includes other "important" companies in China. They are China Merchants Property Development Co. Ltd., Bank of Communications Co. Ltd., China National Materials Co. Ltd., China Merchants Bank Co Ltd., China Petroleum & Chemical Corporation, CSR Corporation Ltd., Bank of China, Industrial and Commercial Bank of China, China Western Power Industrial Company Limited, China Communications Service Corporation Ltd., Aluminum Corporation of China, China United Network Communications Ltd., Hang Seng Bank (China) Ltd., Guangzhou Shipyard international.
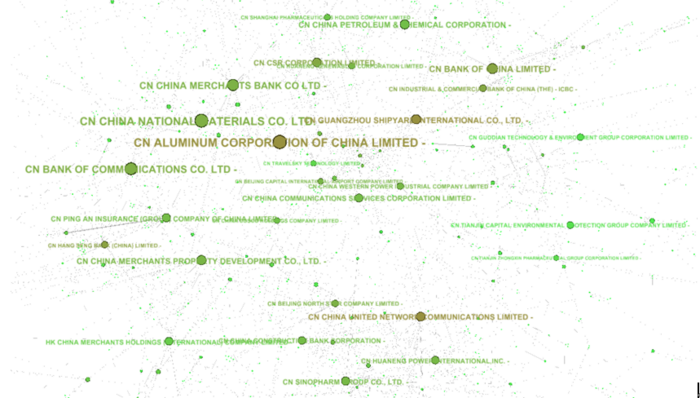
According to these results, we can say that most of them are reasonable to regard as "important" companies in China. China Petroleum & Chemical Corporation, Aluminum Corporation of China and China National Materials CO. Ltd. are biggest and most profitable companies that relating to metallurgical and chemical industry. They have very important impact on China's economy that produces necessary. Bank of China, China Merchants Bank Co Ltd., Industrial and Commercial Bank of China, Bank of Communications Co. Ltd. and Hang Seng Bank (China) Ltd. are biggest banks in China that did a lot invest and hand out numerous loans. Besides, China Communications Service Corporation Ltd., China United Network Communications Ltd. are key telecommunication providers. Moreover, China Construction Bank, Industrial and Commercial Bank of China, China Petroleum & Chemical Corporation, China Merchants Bank Co Ltd., Bank of Communications Co. Ltd., Bank of China are most profitable companies in China.
However, we believe the importance of oil companies and banks might not been clearly stated by the board member links. Oil companies usually earn tens of billions of profits and they are usually the most profitable companies. Although they are most state owned companies and usually do not share board member with other companies, they may have many interactions with thousands of upstream and downstream firms. For example, crude oil shipping companies, refined petroleum manufactory companies, and even factories that needs plastic and chemical fiber as their raw material. Petroleum companies actually affect almost every part of the countries' economy and even the world. China Petroleum & Chemical Corporation is definitely one of the most important companies in China, but China National Petroleum Corporation, which is another equivalent state-owned petroleum company, should also appear in this top company list.
As for banks, this kind of relationship still cannot state theirs importance clearly. The four main state owned bank, Industrial And Commercial Bank Of China(ICBC), Agricultural Bank of China (ABC), Bank of China(BOC), China Construction Bank(CCB),occupy more 50% loan of China at peak, they contributes a lot to the China’s economy and have a great impact on all walks of life. But only two of them are showing in figure 9. All of them are the top 30 banks all around the world, they may have shared board members world widely, but if we only digging their relationships within China, and it might hard for we to find out its accurate importance. Besides, banks may more prefer to gain their profits by giving loans, so it might be hard for us to gain its centrality only by searching shared board members.
To conclude, although some of important companies are not selected as the "important" companies by centrality methods, most results that it generates are reasonable and accurate.
Future work
- More aspects of the result should be evaluated.
- More evaluation methods should be carried.
- Case study on other countries.
- Implement same method on weighted corporate network.
Annotated Bibliography
- ↑ S. Vitali, J. B. Glattfelder, and S. Battiston. The network of global corporate control. PLoS ONE, 6(10), article25995, 2011.
- ↑ Takeuchi, I., Bengio, Y. and Kanamori, T., 2002. Robust regression with asymmetric heavy-tail noise distributions. Neural Computation, 14(10), pp.2469-2496.
- ↑ Graph (discrete mathematics) Available at https://en.wikipedia.org/wiki/Graph_(discrete_mathematics) [Accessed Apr 10, 2016]
- ↑ Defining Two-mode Networks, available at https://toreopsahl.com/tnet/two-mode-networks/defining-two-mode-networks/
- ↑ Borgatti, S. P., Everett, M. G., 1997. Network analysis of 2-mode data. Social networks 19, 243-269.
- ↑ Latapy, M., Magnien, C., Del Vecchio, N., 2008. Basic notions for the analysis of large two-mode networks. Social Networks 30(1), 31-48
- ↑ Seierstad, C., Opsahl, T., 2011. For the few, not the many? The effects of affirmative action on presence, prominence, and social capital of women directors in Norway. Scandinavian Journal of Management 27 (1), 44-54.
- ↑ Freeman, L.C., 1978. Centrality in social networks conceptual clarification. Social networks, 1(3), pp.215-239.
- ↑ Alex Bavelas. Communication patterns in task-oriented groups. J. Acoust. Soc. Am, 22(6):725–730, 1950.
- ↑ Kazuya Okamoto, Wei Chen, and Xiang-Yang Li,"Ranking of Closeness Centrality for Large-Scale Social Networks", Springer-Verlag Berlin Heidelberg 2008.
- ↑ Betweenness centrality, Available at: http://en.wikipedia.org/wiki/Betweenness_centrality
- ↑ PageRank Available at: https://en.wikipedia.org/wiki/PageRank [Accessed Apr 10, 2016]
- ↑ Brin, S. and Page, L., 2012. Reprint of: The anatomy of a large-scale hypertextual web search engine. Computer networks, 56(18), pp.3825-3833.
- ↑ F. Galton, "The British Association: Section II, Anthropology: Opening address by Francis Galton, F.R.S., etc., President of the Anthropological Institute, President of the Section," Nature, 32 (830) : 507–510.
- ↑ Stigler, Stephen M. (1989). "Francis Galton's Account of the Invention of Correlation". Statistical Science 4 (2): 73–79. JSTOR 2245329.
- ↑ Group Eight, Available at http://en.wikipedia.org/wiki/G8
- ↑ "The World Factbook". Cia.gov.
- ↑ List of countries by GDP, available at http://en.wikipedia.org/wiki/List_of_countries_by_GDP_(nominal)
To Add
Put links and content here to be added. This does not need to be organized, and will not be graded as part of the page. If you find something that might be useful for a page, feel free to put it here.
|
|


