Course:CPSC522/Financial Forecasting using LSTM Networks
Financial Forecasting using LSTM Networks
Principal Author: Gudbrand Tandberg
Abstract
Financial forecasting is an area of mathematical finance concerned with predicting the future values of financial quantities given historical data. This first part of this article presents some background on financial forecasting, and introduces machine learning to the problem. The second part of the article is a presentation of two recent papers in the field focusing on the use of long short-term memory recurrent neural networks to stock price prediction.
The papers presented in this article can be found here:
Deep learning with long short-term memory networks for financial market predictions
A deep learning framework for financial time series using stacked autoencoders and long short-term memory
Related Pages
Recurrent neural networks
Long short-term memory
Time series
Content
Background
Financial Forecasting
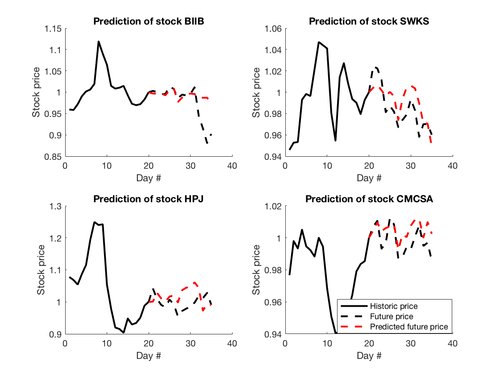
The history of financial forecasting as a discipline goes back at least as far as Graham and Dodd's seminal book Security Analysis. The book, which was published in the early years of the Great Depression, laid the intellectual foundations for what is now called value investing. Although the term value investing has gone through many iterations since its inception, the principal idea behind value investing is that it is possible to make a profit by buying shares in a company, if the market value of the company's shares is lower than the company's intrinsic value. Neoclassical economic theory tells us that the market mechanism will ensure that this value discrepancy is resolved and that market prices will tend towards true values.
A common approach to value investing is through the analysis of a company's fundamentals. A company's fundamentals include quantities such as book value, market capitalization, price-to-earnings ratio and dividend yield.
A more direct approach to investing is to explicitly model future price movements using historical data. If a model predicts that the price of a certain stock will be higher next week, it might be possible to make a profit regardless of what the intrinsic value of the company is. This approach is commonly called technical analysis. Technical analysis relies on the assumption that the future will not be too different from the past. Techniques from time-series analysis and supervised machine learning are particularly well-suited to the problem.
Historically, technical analysis was mostly done using simple if-then rules, based on technical indicators or visual features such as Bollinger bands and head-and-shoulder patterns. With the advent of electronic computers and the digitization of global financial markets the toolbox of the technical analyst quickly expanded to include increasingly more computational methods.
At the extreme end of modern electronic trading is statistical arbitrage, a heavily quantitative and computational approach to stock trading often executed automatically at extremely high frequencies (milliseconds to nanoseconds). Opponents of purely computerized techniques often point to uncertainty induced by the lack of interpretability inherent in the quantitative models. Instead they rely on experienced human investors to take the "rational", human-intelligence-based approach to market analysis. Proponents of automated trading point to a long list of well-documented human behavioral biases such as expert-bias, anchoring, and framing effects[1] Instead they put their faith in well-crafted mathematical models. The irony is that the models themselves are of course made by humans. Will a human-created intelligence ever surpass humans in intellectual prowess? And is human level intelligence even necessary for financial forecasting?
The fundamental question in the field remains: "are stock-prices forecastable?". This is a very hard question to answer, since global stock markets are extremely complex environments. Markets are essentially dynamic, non-linear and chaotic systems, and the time series they contain are non-stationary, noisy, stochastic, and have frequent structural breaks[2]. In addition, stock markets' movements are affected by many macro-economical factors such as political events, index-movement, bank rate, exchange rate, and investors' expectations[3]. Due to the obvious financial incentives, stock price prediction has nonetheless been an extremely active area of research, for investment companies, academics and amateurs alike. For the same reason, there is an unusually high level of opacity in the research being carried out. When a researcher discovers an effective method for price forecasting, it would be contrary to their personal financial interests to publish the results. This has led to the situation that there is very little consensus with regards to the feasibility of technical stock-price forecasting.
One of the fundamental theoretical results on pricing in markets is the efficient market hypothesis (EMH). In its basic form, the EMH states that the price of an asset fully reflects all available information related to that asset. Thus, according to the EMH, even with access to all available information regarding the state of the world, it is impossible to make a profit by trading stocks based on this information. This has not however dissuaded investors from generating millions in profit, and it has not stopped researchers from putting considerable effort into the problem of financial forecasting. Empirical evidence shows that due to a large number of well-known market failures, "all markets are at least somewhat inefficient at least some of the time".

From the early 90s on, a great deal of papers aimed at applying machine learning to financial forecasting began to be published. The most widely applied models were artificial neural networks (ANNs)[4] and support vector machines (SVMs)[5], although everything from linear regression and decision trees to genetic algorithms[6] and particle swarm optimization[7] has seen use. Recently, deep learning methods have been popular.[8] The financial forecasting problem is typically framed as a supervised learning problem, where past data is used as input (in the form of time series), and the output is the prediction of the future value of the underlying quantity. The relative simplicity of this formulation, together with the abundance of available data has made stock price forecasting a widely studied problem for testing and refining machine learning methods for time-series prediction. Alas, the research-literature is hard to interpret, as it can be assumed that most of the unsuccessful attempts at stock price forecasting have gone by unpublished, while the most successful (profitable) attempts still remain proprietary models behind closed doors.
Three key parameters to consider when framing financial forecasting as a supervised learning problem are lookback (how far back in time to extract input time series), frequency (how frequent do we sample stock prices in the input time series), and horizon (how far into the future do we want to predict stock prices). The workflow is similar to any data-driven approach; feature engineering, data transformations, model selection and validation are all important aspects to consider. The general conclusion in most of the published research that follows this supervised learning approach is that stock prices are somewhat predictable. This is not necessarily a refutation of the EMH, since there is still a gap between predictive accuracy and actual profitability. In order to make use of a trained model for real-world trading, constraints such as liquidity, cost of training data, uncertainty, and transaction costs must be taken into account. Furthermore, in machine learning, historical accuracy is no true measure of future accuracy. This is especially important in its application to financial forecasting.
LSTMs

One of the models that has received a lot of attention in recent years is the long short-term memory (LSTM) neural network. LSTMs were first introduced in 1997 by Sepp Hochreiter and Jürgen Schmidhuber[9], but only started to see mainstream usage in recent years, due mainly to huge improvements in accuracy in diverse tasks such as natural language processing[10], video captioning[11], and handwriting recognition[12]. LSTM networks are a special kind of recurrent neural network (RNN), where the "neurons" are replaced with more complex "memory cells". An LSTM cell consists of an input gate, a forget gate and an output gate, and has a set of weights for each of these gates, as well as bias weights. Thanks to this clever architecture, the cells are able to remember values over arbitrary time intervals. For this reason, LSTMs are particularly well-suited for time series, especially if the length and frequency of important events is unknown[13]. Another significant advantage of LSTMs over traditional neural networks is their flexibility with regards to input and output shapes. Whereas traditional neural networks are mostly mappings between fixed sized spaces (e.g. 28-by-28-by-3 color images to one-hot indicator vectors), recurrent neural networks can be adapted to learn arbitrary sequence-to-sequence mappings. The figure below (taken from Andrej Karpathy's excellent blog post "The unreasonable effectiveness of RNNs") shows schematically the main input-output architectures available for LSTMs. A rectangle represents a vector, while arrows represent transformations.

In recent years, renewed faith in big-data techniques such as deep learning and reinforcement learning has led to a surge in research in machine learning and artificial intelligence. Also in the financial forecasting literature has this surge been noticeable[14]. In the next section we present two recent papers focused on applying LSTM networks to financial forecasting.
Paper 1: Deep learning with long short-term memory networks for financial market predictions
The paper Deep learning with long short-term memory networks for financial market predictions from May 2017 by Fischer and Krauss claims to be the first attempt to "deploy LSTM networks on a large, liquid, and survivor bias free stock universe to assess its performance in large-scale financial market prediction tasks" (in financial forecasting, survivor bias is the tendency to focus disproportionately on companies that did not go bankrupt during the training phase). The paper presents an in-depth guide to the data processing, development, training and deployment of several large scale experiments in financial time series forecasting. The paper builds on earlier work by the same authors where they found that traditional deep neural networks were not able to significantly outperform simpler memory-free models such as random forests and gradient-boosted trees[15]. In addition to deploying their trained networks in a comprehensive back-testing environment, the paper also sheds light into the black-box nature of LSTM networks. Specifically, the authors observe that the stocks selected for trading exhibit "high volatility, below-mean momentum, extremal directional movements in the last days prior to trading, and a tendency for reversing these extremal movements in the near-term future." The paper goes on to formulate these findings as a simplified rules-based trading strategy capturing the essence of the patterns picked up by the LSTMs. They find that around 50% of the variance of the LSTM returns are explained by their simplified strategy and conclude that the remaining returns are presumably due to "more complex patterns and relationships extracted from return sequences".
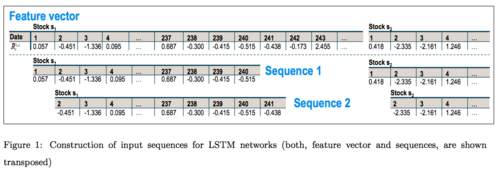
As training data, the authors collect daily return indices for all stocks on the S&P 500 index from 1989 to 2015. This is a significant amount of data, amounting to over 6000 trading days over a period of 25 years. This is considerably more than most other academic papers on the subject. This is likely because large-scale financial data is expensive to acquire. As the constituents of the S&P 500 index changes significantly from year to year, survivor bias is a significant concern. To eliminate survivor bias, the authors first generate a binary matrix signaling which stocks were a part of the index at the start of each month during the whole training period. Time series for constituent stocks are then extracted using this binary matrix. Next, the authors split the entire dataset into 23 study periods. A study period is defined as 750 days of training data and 250 days of trading data. The 23 study periods are aligned in time so that there is no overlap between adjacent trading periods. The stock price sequences are then transformed into return sequences by setting the price equal to 1 on the first training day and replacing all subsequent prices with the relative change from the previous day. Next, the return sequences are standardized by subtracting the mean and dividing by the standard deviation of the training set. Finally, input sequences are generated from staggered slices of the return sequences. In the end, each study period contains approximately 255000 training sequences and 125000 sequences used for out-of-sample predictions. As response variable, the authors choose to follow earlier work and consider only the binary classification problem. The response variable of an input sequence is +1 if the stock performed better than the cross-sectional median, and -1 if the stock under-performed.
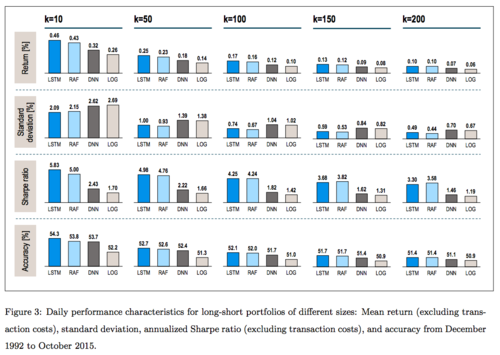
The network architecture used in the paper consists of an input layer with 1 feature and 240 timesteps followed by a hidden layer with 25 hidden LSTM cells and a dropout rate of 0.1. This is then crowned with a fully connected two-neuron layer with softmax activation. Simulations are run in the Python/Theano/Pandas environment a single GPU. Information about training times are not provided in the paper. For a single input sequence, the output of the network can be interpreted as the probability that the stock will outperform the median on the following trading day. The authors use this output to test their predictions in a trading environment. The outperformance probabilities of all stocks are ranked and portfolios are selected by buying the top stocks and lending the bottom stocks every trading day. The same portfolio selection method is also applied to predictions generated by random forests, a deep neural network and a logistic regression model. Detailed results are presented in the paper, the main result the paper highlights is that LSTMs consistently outperform the other models. To really underscore this point the authors offer an extra benchmark based on completely random stock-selection. They find "a probability of 2.7742e-187 that a random classifier performs as well as the LSTM by chance alone".
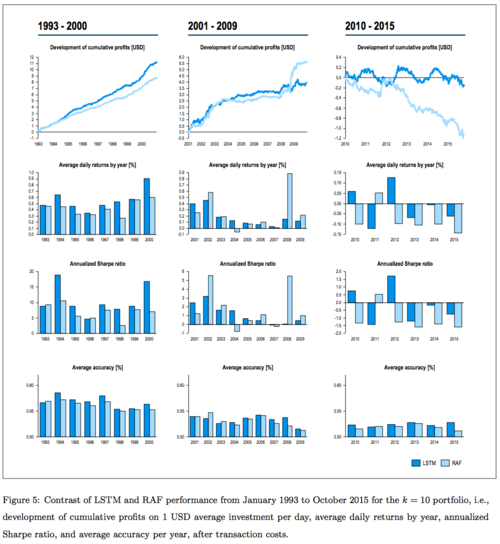
The final sections of the paper look into the reasons why the LSTM network performs so well at this task. Again, the details can be found in the paper, the main point the authors stress is that the selections can be interpreted from a financial/economical viewpoint, and that this insight could be useful to investors looking to use these advanced techniques in their investing, while at the same time being reluctant to trust a black box prediction. An interesting observation the authors note is the trend towards less profitability as time progresses through the study periods. A potential cause for this is that competition is increasing, and more model-based investing reduces the profitability of these very methods. This goes back to market efficiency, and suggests that the more actors in a market are trying to leverage inefficiencies, the more efficient the market becomes. Also, it is interesting to note that the most profitable period in the whole data set was during the 2008 financial crisis. This certainly speaks for the case of compensating human fallibility with machine intelligence, at least in some situations.
All in all, this is a very interesting and well-written paper on the topic of financial forecasting. As one of the first published papers to apply LSTMs, the authors do an exceptionally good job of clearly presenting their methodology and their results. The research is completely reproducible, and all the results are presented along with statistical tests. The real-world significance of the extensive back-testing is questionable, but the innovations the model brings to the table seem to be significant. As the authors conclude, "overall, we have successfully demonstrated that an LSTM network is able to effectively extract meaningful information from noisy financial time series data", and that "as it turns out, deep learning [...] seems to constitute an advancement in this domain as well"
Paper 2: A deep learning framework for financial time series using stacked autoencoders and long short-term memory

The paper A deep learning framework for financial time series using stacked autoencoders and long short-term memory by Bao, Yue and Rao from July 2017 extends the Fischer and Krauss paper presented above by incorporating two additional steps of preprocessing to the data-pipeline. These are the wavelet transform and stacked autoencoders. The wavelet transform is used initially as a denoising step, as financial time series are known to be very noisy. Next, autoencoders are used to extract high-level features from the denoised time-series. These features are then fed into a LSTM regression network. The authors compare their proposed model to three different benchmark models in 6 different stock indices and find that their model outperforms the other models in all cases. Although this paper uses a much smaller dataset than Fischer and Krauss, the dataset is also richer in the sense that not only stock prices are considered but also technical indicators and macro-economical variables. This allows the authors to leverage the power of LSTMs more fully, as the inputs are not just one-dimensional return values but full vector-valued time-series. Additionally, the more involved data processing can be seen as an improvement over the previous paper, as the authors find that dropping either of the two processing steps reduces accuracy.
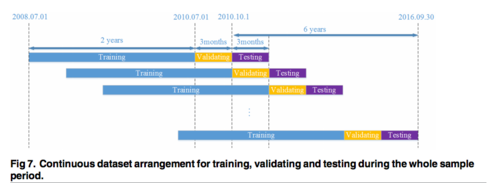
The dataset used in the paper was obtained for free and is available at [1]. The authors considered the period from July 2008 to September 2016, and collected data in three different categories; stock prices (open, high, low, and closing prices are used, as well as daily trading volume), technical indicators, and macroeconomic variables (exchange rate and interest rate). All in all the input sequences are 19-dimensional. Similarly to Fischer and Krauss, the authors split the dataset into disjoint trading periods (called testing periods in this paper). The dataset is split into two years of training, followed by a quarter for validation, and then a final quarter for testing. In total, 24 of these periods are extracted. All of the variables of interest are collected from the six indices CSI 300, Nifty 50, Hang Seng Index, Nikkei 225, S&P500 and the DJIA. The rationale for testing the model in these different indices is emphasized in the paper; since markets in different stages of development exhibit different characteristics, the different indices are studied to validate the robustness of the model. In particular, markets in less developed economies such as India and China are less efficient and less regulated, while indices based in America tend to be more efficient and regulated.
The paper begins with an in-depth presentation of wavelet transforms, autoencoders, and LSTM networks. Wavelets are chosen over other denoising methods due to their ability to efficiently analyze frequency components in a signal over time. The wavelet transform of a signal is essentially a decomposition of the signal into separate frequency channels, typically implemented using digital filters. After being decomposed into frequency components, the input time series vectors are fed into a 4-layer stacked autoencoder. Autoencoders have recently become extremely popular feature extractors in many fields, largely thanks to their early success in image based object recognition[16]. In the image analysis context, deep neurons in a network learn to respond to high level features such as shapes, patterns and faces. The motivation for using autoencoders in this paper is analogous to the image analysis example. This is based on the assumption that there exist high level features in market data that can be used to predict the future. In many ways this extends the early work in technical analysis, where visual patterns in past data were used to evaluate a company's future prospects. Finally, the high level features extracted by the stacked autoencoders are fed into an LSTM network, in a similar fashion to Fischer and Krauss. A difference in this paper's approach is that instead of binary classification, these networks attempt to directly predict next day closing prices. This could be leveraged to result in even more refined trading strategies.
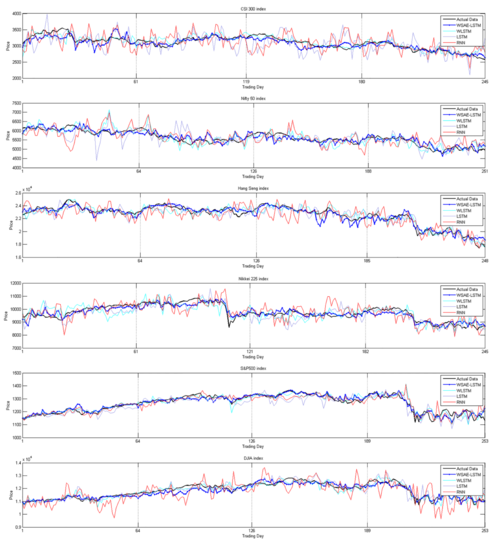
The proposed model, referred to as the WSAE-LSTM model, is compared with three benchmark models: WLSTM (without stacked autoencoders), LSTM (without autoencoders and wavelet transform) and a traditional RNN. Performance of the models are evaluated using mean absolute predictive accuracy, as well as tested for profitability using simple buy-sell signals derived from the predictions. The results are presented in great detail in the paper, and significance tests for all presented results are given at a 5% confidence level. The results are overwhelmingly positive with respect to all metrics, with the WSAE-LSTM model outperforming all the other models in all periods in all indices.
This paper presents several extensions to the Fischer and Krauss paper presented above. Among these is the use of more input features, validation and hyper-parameter estimation, regression over classification, a wider range of test environments and a more complex data processing pipeline. The main drawback compared with Fischer and Krauss is the much smaller timescale studied (6 years compared with 25 years), and the much smaller universe of stocks used for training. If combined, the strengths of the two papers would most certainly produce extremely impressive results. Alas, academic studies in financial forecasting are hard to validate, especially in terms of real world feasibility. To make things worse, thanks to the EMH, any forecasting model that can be considered "public information" loses much of its potential for profitability once it becomes common knowledge.
Conclusion and future directions
The future of AI-driven investment is uncertain. On the one hand, there is still plenty of room for improvement and refinement of the models being studied. More exotic and powerful neural networks will continue to push the boundaries of what is possible in financial forecasting while advancements in economic modeling and data-driven machine intelligence will allow us to build more and more complex and accurate models. At the same time, developments in the underlying theory of market dynamics will teach us more about what to expect from our models. Of course, it is also important to be reminded of the reasons for having financial markets in the first place. The market process is supposed to be a stabilizing force in the economy, a force of efficient redistribution of goods and services and of generating and sustaining growth and value in a regulated, competitive way. It is not clear how a purely profit-motivated AI-agent executing trades at millisecond intervals is commensurate with these basic goals. In addition, it is not clear how these agents affect markets in the first place. At the same time, as one investor puts it: "self-driving cars are coming, and so are self-managing funds"[17]. Every year, a larger percentage of the total volume of stocks traded is executed by automated agents. It is the important task of future economists to prepare markets for the impending changes. As another investor puts it: "big data strategies are increasingly challenging traditional fundamental investing and will be a catalyst for changes in the years to come."[18].
Further Reading
The following links serve as a useful starting point for those interested in learning more about the topic covered in this article.
Financial economics
Financial signal processing
Quantitative analysis
Stock market prediction
Andrej Karpathy — The unreasonable effectiveness of recurrent neural networks
Notes on LSTMs in finance
Forecasting stock market prices: Lessons for forecasters
Common mistakes when applying computational intelligence and machine learning to stock market modelling
Evaluating machine learning classification for financial trading: An empirical approach
Deep learning networks for stock market analysis and prediction: Methodology, data representations, and case studies
Time series prediction using support vector machines: a survey
Market efficiency, long-term returns, and behavioral finance
References
- ↑ Kahneman, Daniel. Thinking, fast and slow. Macmillan, 2011.
- ↑ Granger, Clive WJ. "Forecasting stock market prices: Lessons for forecasters." International Journal of Forecasting 8.1 (1992): 3-13.
- ↑ Kara, Yakup, Melek Acar Boyacioglu, and Ömer Kaan Baykan. "Predicting direction of stock price index movement using artificial neural networks and support vector machines: The sample of the Istanbul Stock Exchange." Expert systems with Applications 38.5 (2011): 5311-5319.
- ↑ Zhang, Guoqiang, B. Eddy Patuwo, and Michael Y. Hu. "Forecasting with artificial neural networks:: The state of the art." International journal of forecasting 14.1 (1998): 35-62.
- ↑ Tay, Francis EH, and Lijuan Cao. "Application of support vector machines in financial time series forecasting." Omega 29.4 (2001): 309-317.
- ↑ Mahfoud, Sam, and Ganesh Mani. "Financial forecasting using genetic algorithms." Applied artificial intelligence 10.6 (1996): 543-566.
- ↑ Bagheri, Ahmad, Hamed Mohammadi Peyhani, and Mohsen Akbari. "Financial forecasting using ANFIS networks with quantum-behaved particle swarm optimization." Expert Systems with Applications 41.14 (2014): 6235-6250.
- ↑ Alberg, John, and Zachary C. Lipton. "Improving Factor-Based Quantitative Investing by Forecasting Company Fundamentals." arXiv preprint arXiv:1711.04837 (2017).
- ↑ Hochreiter S, Schmidhuber J. Long short-term memory. Neural computation. 1997 Nov 15;9(8):1735-80.
- ↑ Graves, Alex, Abdel-rahman Mohamed, and Geoffrey Hinton. "Speech recognition with deep recurrent neural networks." Acoustics, speech and signal processing (icassp), 2013 ieee international conference on. IEEE, 2013.
- ↑ Venugopalan, Subhashini, et al. "Translating videos to natural language using deep recurrent neural networks." arXiv preprint arXiv:1412.4729 (2014).
- ↑ Graves, Alex. "Generating sequences with recurrent neural networks." arXiv preprint arXiv:1308.0850 (2013).
- ↑ https://en.wikipedia.org/wiki/Long_short-term_memory
- ↑ Chong, Eunsuk, Chulwoo Han, and Frank C. Park. "Deep learning networks for stock market analysis and prediction: Methodology, data representations, and case studies." Expert Systems with Applications 83 (2017): 187-205.
- ↑ https://ideas.repec.org/p/zbw/iwqwdp/032016.html
- ↑ http://ieeexplore.ieee.org/abstract/document/6639343/
- ↑ http://www.acatis.com/en/startseite
- ↑ https://www.cnbc.com/2017/06/13/death-of-the-human-investor-just-10-percent-of-trading-is-regular-stock-picking-jpmorgan-estimates.html
To Add
|
|
