1.3 - The Probability Mass Function
Usually we are interested in experiments where there is more than one outcome, each having a possibly different probability. The probability mass function of a discrete random variable is simply the collection of all these probabilities.
| Probability Mass Function |
|---|
| The probability mass function (PMF) of a discrete random variable X provides the probabilities Pr(X = x) for all possible values of x. This function can be represented in a table, graph or formula. |
Example: Different Colored Balls
Although it is usually necessary to define random variables that assume numerical values, this need not always be the case. Suppose that a box contains 10 balls:
- 5 of the balls are red
- 2 of the balls are green
- 2 of the balls are blue
- 1 ball is yellow
Suppose we take one ball out of the box. Let X be the random variable that represents the color of the ball. As 5 of the balls are red, and there are 10 balls in total, the probability that a red ball is drawn from the box is Pr(X = Red) = 5/10 = 1/2. [Note: this random variable does not have numerical outcomes, but we could easily fix this by assigning different numbers to the different colors we could observe.]
Similarly, there are 2 green balls, so the probability that X is green is 2/10. Similar calculations for the other colors yield the probability mass function of X given by the following table.
| Ball Color | Probability |
|---|---|
| red | 5/10 |
| green | 2/10 |
| blue | 2/10 |
| yellow | 1/10 |
Example: A Six-Sided Die
Consider again the experiment of rolling a six-sided die. A six-sided die can land on any of its six faces, so that a single experiment has six possible outcomes.
For a "fair die", we anticipate getting each of the results with an equal probability, i.e. if we were to repeat the same experiment many times, we would expect that, on average, the six possible events would occur with similar frequencies (we say that such events are uniformly distributed).
There are six possible outcomes: 1, 2, 3, 4, 5, or 6. The probability mass function could be given by the following table.
| Outcome | Probability |
|---|---|
| 1 | 1/6 |
| 2 | 1/6 |
| 3 | 1/6 |
| 4 | 1/6 |
| 5 | 1/6 |
| 6 | 1/6 |
The PMF could also be given by the equation Pr(D = k) = 1/6, for k = 1, 2, 3, ... , 6, where D denotes the random variable associated to rolling a fair die once. Thus we see that discrete uniform random variables have PMFs which are particularly easy to represent.
Example: Test Scores
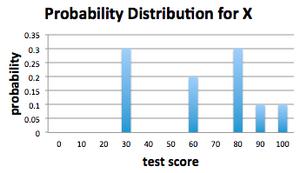
Suppose that in a class of 10 people the grades on a test are given by 30, 30, 30, 60, 60, 80, 80, 80, 90, 100. Suppose a test is drawn from the pile at random and the score X is observed. We would like to calculate the probability mass function for the randomly drawn test score.
Looking at the test scores, we see that out of 10 grades:
- the grade 30 occurred 3 times
- the grade 60 occurred 2 times
- the grade 80 occurred 3 times
- the grade 90 occurred 1 time
- the grade 100 occurred 1 time
This tells us the probability mass function of the randomly chosen test score X which we present formally in the following table.
| Grade, xk | Probability, Pr(X = xk ) |
|---|---|
| 30 | 3/10 |
| 60 | 2/10 |
| 80 | 3/10 |
| 90 | 1/10 |
| 100 | 1/10 |
We have described the PMF in a table, but an equivalent representation could be given in a graph that plots the possible outcomes of X on the horizontal axis, and the probabilities associated to these outcomes on the vertical axis. Below is the graph of the probability mass function for the random variable X.
