File:MATH200 Dec2011 Q1a figure.png
No higher resolution available.
MATH200_Dec2011_Q1a_figure.png (379 × 379 pixels, file size: 0 bytes, MIME type: image/png)
Summary
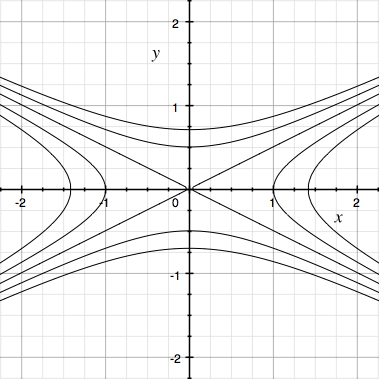
| Description | English: A plot of the level curves of f(x,y) as defined in Q1a of the Dec 2011 final exam of MATH200. |
| Date | 2 April 2014 |
| File source | Own Work |
| Author | WilliamThompson |
Licensing
|
File history
Click on a date/time to view the file as it appeared at that time.
| Date/Time | Thumbnail | Dimensions | User | Comment | |
|---|---|---|---|---|---|
| current | 17:11, 2 April 2014 | | 379 × 379 (0 bytes) | WilliamThompson (talk | contribs) |
You cannot overwrite this file.