File:Graph 3.jpg
No higher resolution available.
Graph_3.jpg (497 × 375 pixels, file size: 22 KB, MIME type: image/jpeg)
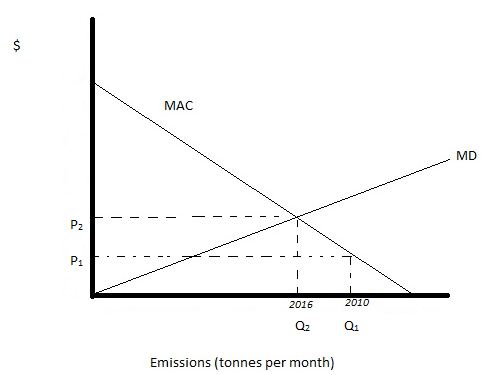
Currently, the automobile market is at a point like the 2010 mark of Q1 and P2. When 2016 approaches and the new standards take into place, the market will be at an efficient point of Q2 and P2. At this point, there is an increase in marginal abatement costs, but a reduction in emissions. The costs increase due to better parts in the production of cars, as well as enforcing the new regulations which take time and effort.
File history
Click on a date/time to view the file as it appeared at that time.
| Date/Time | Thumbnail | Dimensions | User | Comment | |
|---|---|---|---|---|---|
| current | 00:32, 7 October 2010 | | 497 × 375 (22 KB) | AkhilGupta (talk | contribs) | Currently, the automobile market is at a point like the 2010 mark of Q1 and P2. When 2016 approaches and the new standards take into place, the market will be at an efficient point of Q2 and P2. At this point, there is an increase in marginal abatement co |
You cannot overwrite this file.
File usage
The following page uses this file: