File:Global Ocean Alkalinity.png
Size of this preview: 787 × 600 pixels. Other resolution: 2,036 × 1,552 pixels.
Original file (2,036 × 1,552 pixels, file size: 3.15 MB, MIME type: image/png)
Summary
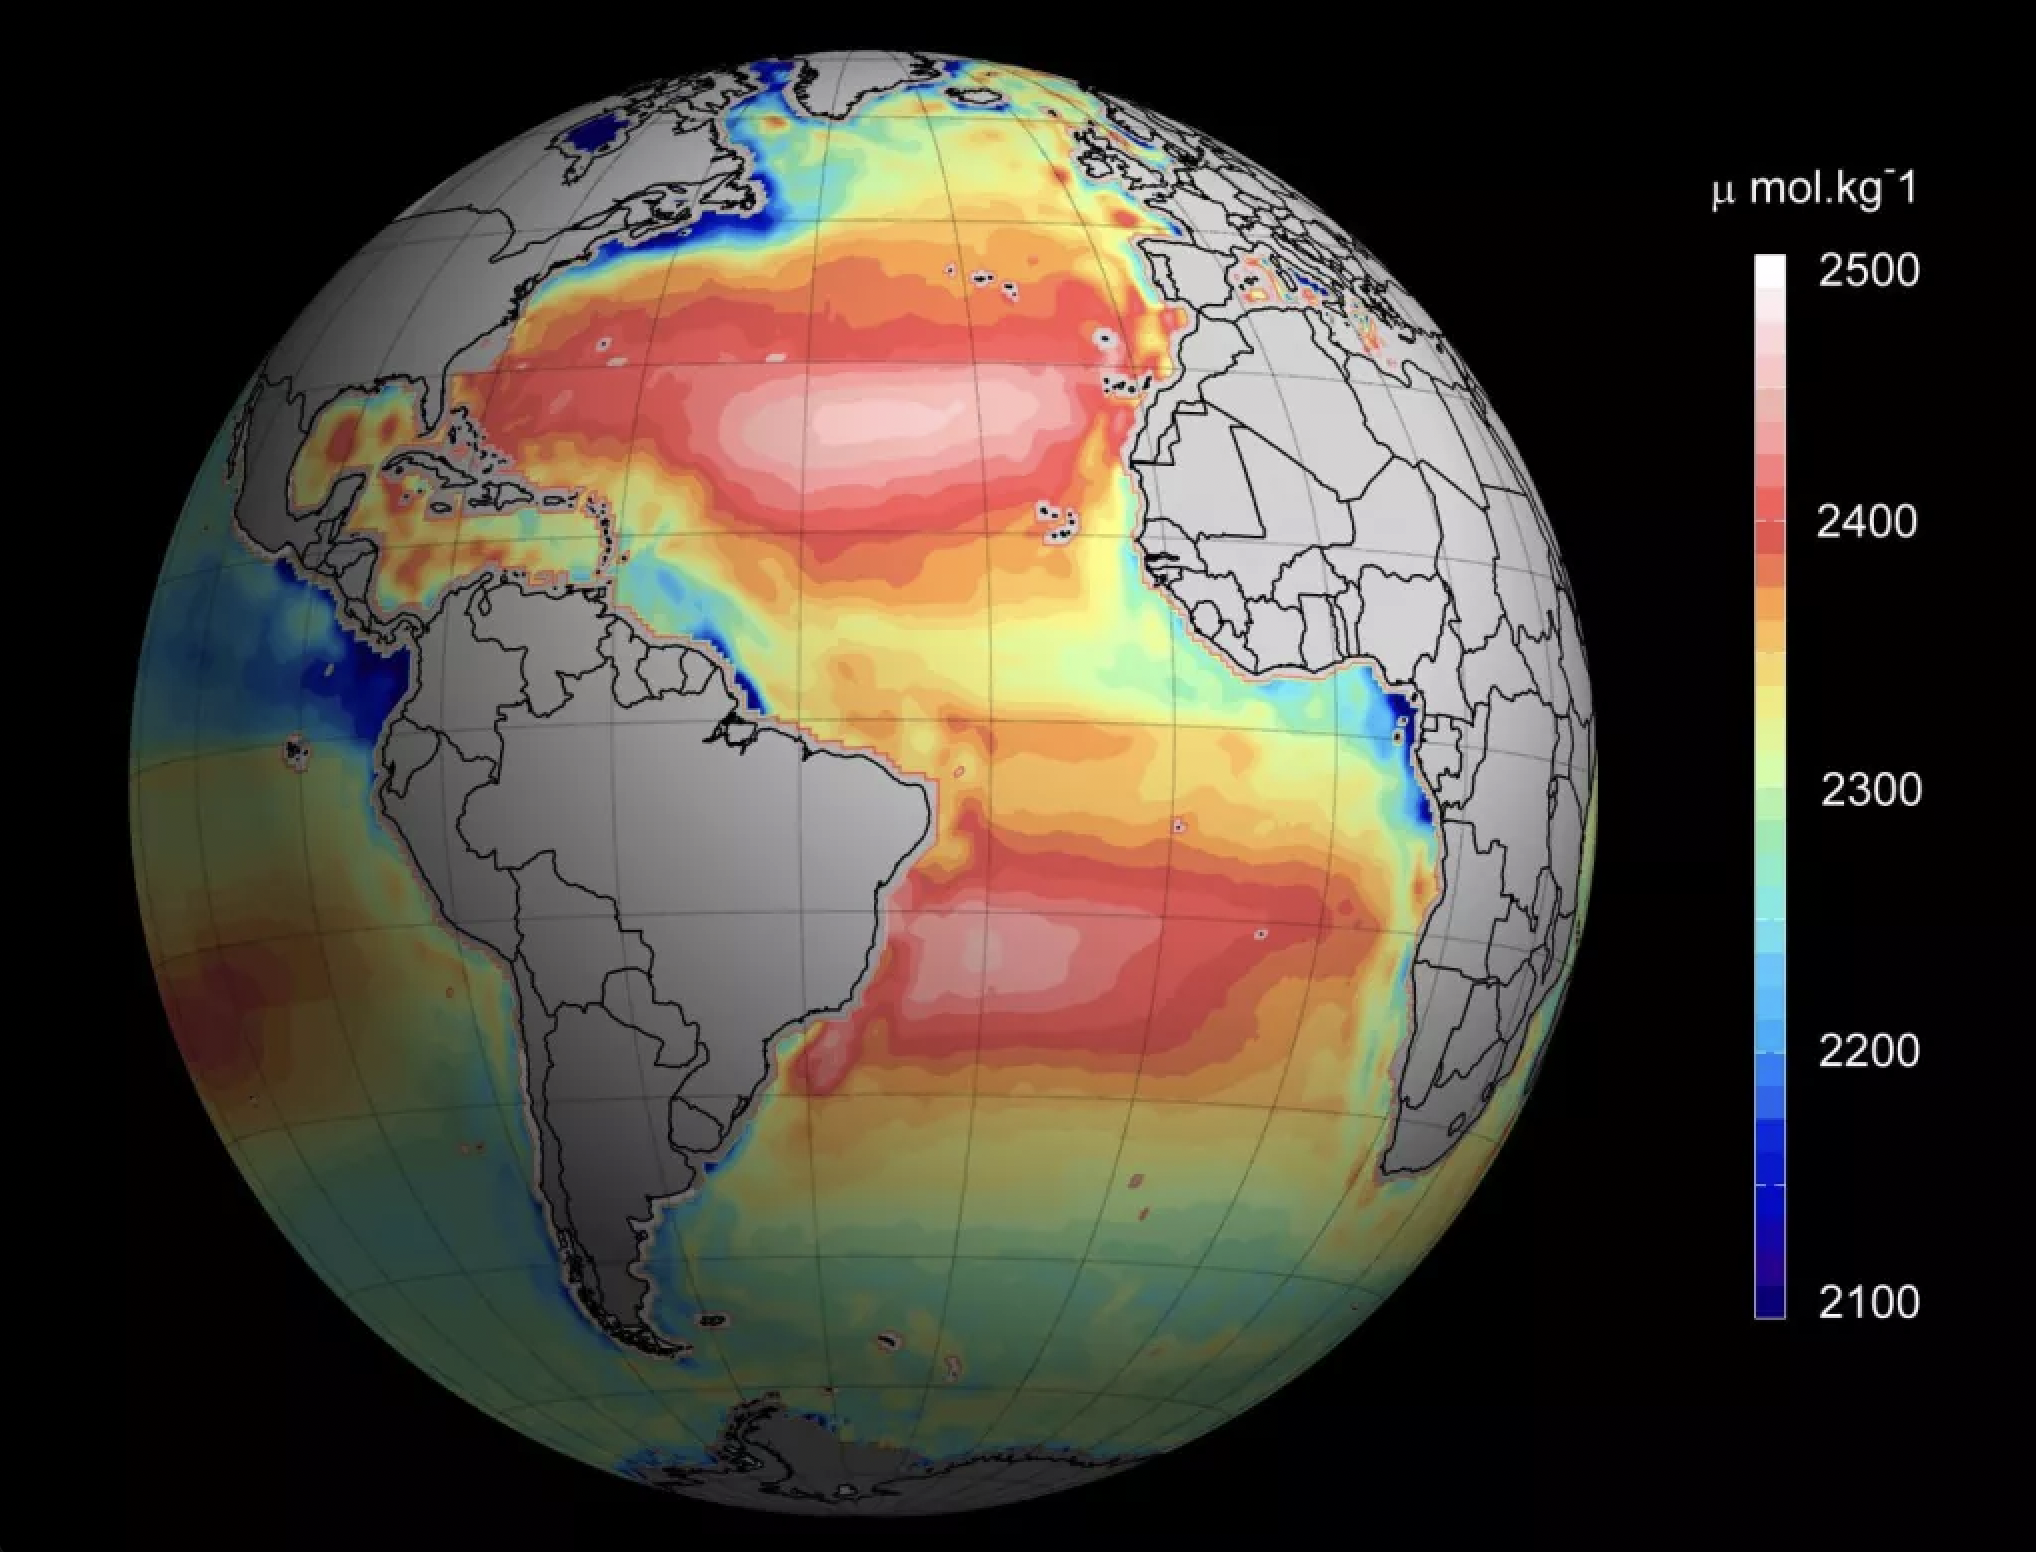
| Description | English: This graph shows the global ocean's alkaline level. The warmer color indicates a higher alkaline level, which means stronger resistance to ocean acidification (Pappas, 2015). |
| Date | 17 February 2015 |
| File source | https://www.livescience.com/49831-maps-reveal-ocean-acidification.html |
| Author | Ifremer/ESA/CNES |
Licensing
|
|
File history
Click on a date/time to view the file as it appeared at that time.
| Date/Time | Thumbnail | Dimensions | User | Comment | |
|---|---|---|---|---|---|
| current | 02:31, 7 February 2022 | | 2,036 × 1,552 (3.15 MB) | ShuyiFang (talk | contribs) | Uploaded a work by Ifremer/ESA/CNES from https://www.livescience.com/49831-maps-reveal-ocean-acidification.html with UploadWizard |
You cannot overwrite this file.
File usage
The following page uses this file: