Science:Math Exam Resources/Courses/MATH152/April 2022/Question B2 (a)/Hint 1
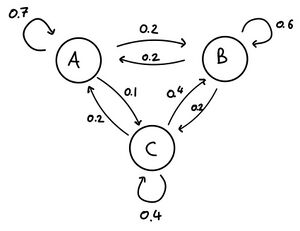
It may be helpful model the random walk using a graph with vertices labelled , for the events "buying Ambrosia," etc. and with edges labelled by the probabilities of moving from one event to the other over the course of a week, as in the figure below.
Can you recall how these probabilities form the inputs of the transition matrix? Try to find it in §4 of the course notes by profs. Froese and Wetton, found here.


