Science:Math Exam Resources/Courses/MATH104/December 2016/Question 09 (c)/Solution 1
From the part (a), we have .
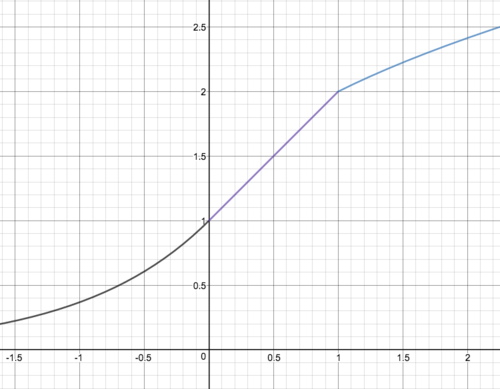
On the interval , we draw the exponential function graph which ends at the point .
Then, we can easily draw the linear function on the interval , which starts from the point and has the slope . Indeed, it ends at .
Finally, on , we draw the graph of which can be obtained by translating the graph of up 1 unit.
To sum, we get the following sketch of the graph of as follows.

![{\displaystyle (-\infty ,0]}](https://wiki.ubc.ca/api/rest_v1/media/math/render/svg/0241c015ef4c611c9c9aeafb395e7c4a16178405)


![{\displaystyle (0,1]}](https://wiki.ubc.ca/api/rest_v1/media/math/render/svg/7e70f9c241f9faa8e9fdda2e8b238e288807d7a4)


