Course:CPSC522/Analyzing online dating trends with Weka
Analyzing online dating trends with Weka
Author: Ritika Jain
Abstract
A very large OKCupid dataset (with 2620 attributes and over 68,000 instances) has been analyzed to form clusters as an unsupervised learning task. The rationale behind the clustering is that broadly speaking, population can be segmented into clusters based on their behavioural attributes (which in this project are accessed using OkCupid questions and answers) and we can find a representative profile which broadly matches that cluster.
Builds on
- The OKCupid dataset: A very large public dataset of dating site users
- How a math genius hacked OkCupid
- K means clustering
Related Pages
- Amy Web: How i hacked online dating
- How machine learning can transform online dating
- The effects of humor and laughter on perceived intelligence and dating success
Content
Hypothesis
The goal of this page is to present the analysis on online dating trends (some initial ideas are: form clusters of dating profiles of men and women based on the questions they answer and the values in the partner they cannot compromise on; and then for each cluster try to make an ideal profile which would achieve greater than 90% match rate). I will be working with OkCupid's dataset and using Weka to train, cluster and visualize OkCupid's dataset. Inspiration from this Math geek[1]
Almost-fake OkCupid account
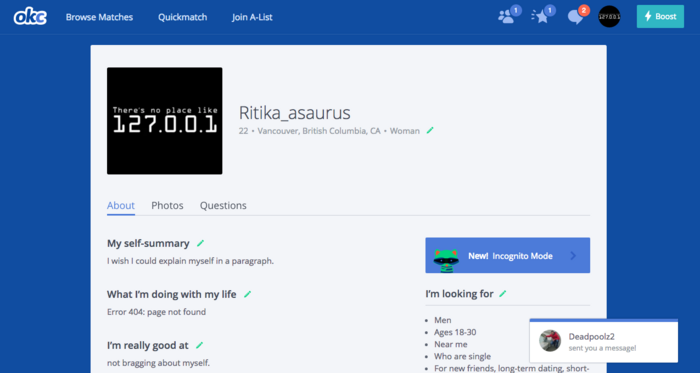
To be able to understand how OkCupid works, the first step was to create an almost-fake account for myself. The reason i say fake is because I'm not actively looking to date online. The reason i say almost is, I still want to be taken as a legit user by the online dating community. So here is what my profile looks like[2]:
Next, I go on to see how to find matches for myself. OkCupid gives me the option to find matches according to preferred age, orientation, and location of who I want to meet. I make these changes in my "I'm Looking For" settings and this immediately adjusts the matches I see around the site. I can also use the “Order By” dropdown to choose how my matches are ranked and presented to me. Sorting by OkCupid's “Special Blend” looks at many different things—more than just match percentage and last login time—and show some great matches that might not otherwise have shown up. I however sort by match percentage because that is the parameter I am interested in for this project.
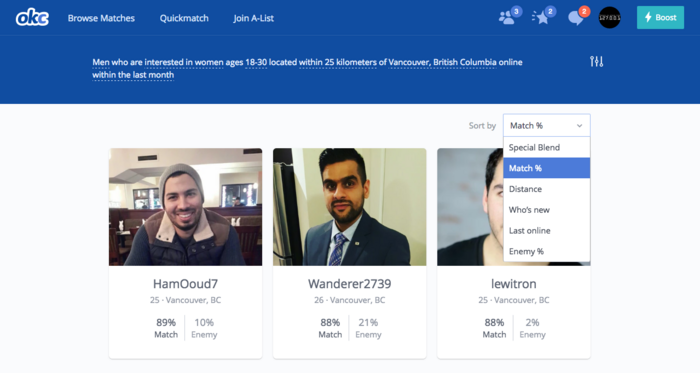
It turns out, I don't need to do much more than this. Being a woman, that too in Vancouver, that's about all I need to do. I get profile likes, profile visits and messages streaming into my OkCupid inbox. This validates an interesting article by OkTrends called 'A Woman's advantage'.
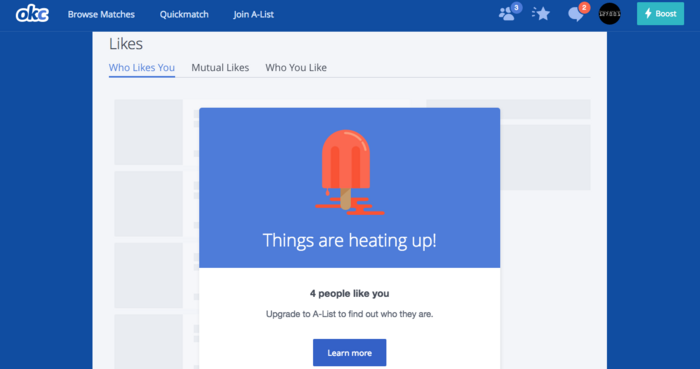
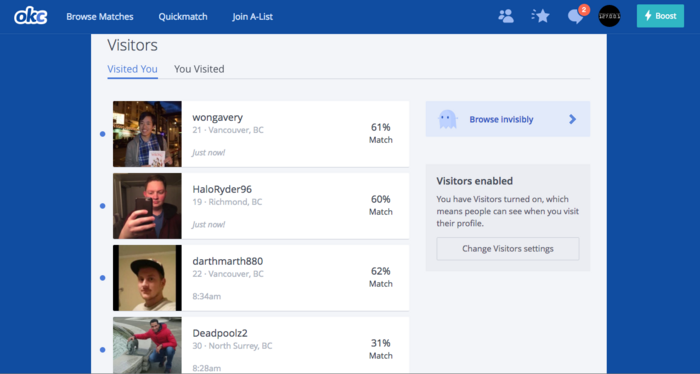
I can also see people who are viewing my profile. I also have the options to browse invisibly at profiles, so they don't know I am looking at their profiles. I can also hide and unhide 'real' stalkers. The snapshot of people viewing my profile is shown below[2]:
OkCupid's question and answers
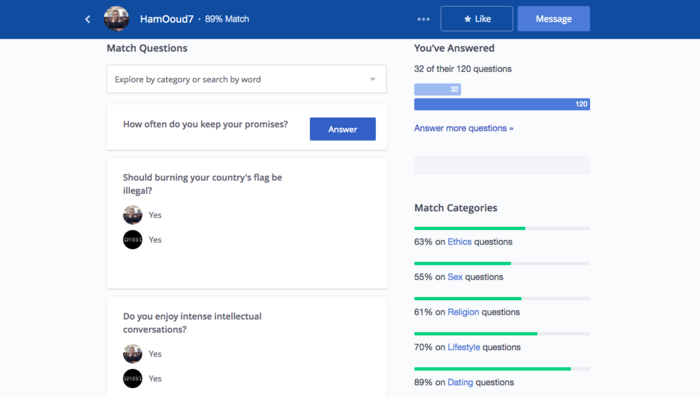
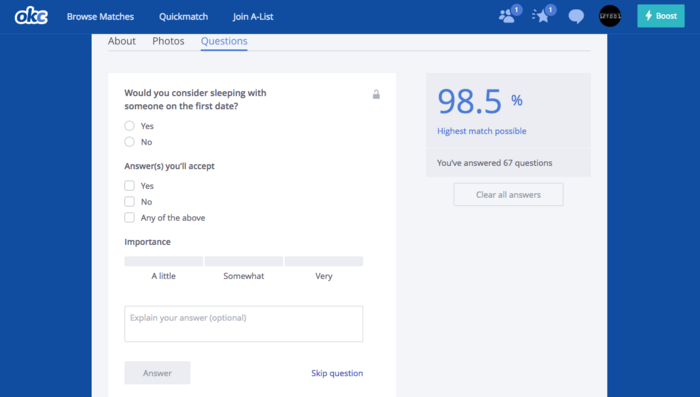
The questions on the site are made by users themselves, but some initial questions were made by the staff. Questions concern multitude of topics ranging from questions on Ethics, Sex, Religion, Lifestyle, Dating etc. By default, the questions are presented to users in the order of the questions having the most answers already.[3] This minimizes the number of questions that a new user has to answer out before having many in common with other users, but has the cost of starkly decreasing the diversity of questions answered. Still, because users often answer hundreds if not thousands of questions, a great amount of data is available. It is also possible to answer any question by going directly it to, or finding it in some other user's profile. The snapshot for answering questions by going to some other user's profile is shown below[2]:
The more the number of questions I answer, the more are my chances of finding a higher match percentage. For instance, in my profile I have answered 67 questions and the highest match percentage possible is 98.5% (assuming someone answers all my questions exactly how I would like them to and I don't give wrong answers to the questions important to them). The algorithm for match percentages is detailed below which will make things clearer.
OkCupid's matching algorithm
After setting up my profile and understanding my way around the basic functionalities of the site, I go on to explore how OkCupid suggests matches to me. OkCupid has a very interesting matching algorithm. They calculate match percentages by matching your answers to questions with the other person's expected answers and vice versa.
1. For each question, three values are collected from a user:
a) Your answer
b) How you'd like someone else to answer
c) How important the question is to you
2. Calculating the match:
Assigning numeric values to the four levels of importance: irrelevant, a little important, somewhat important and very important.
| Level of Importance | Point value |
|---|---|
| Irrelevant | 0 |
| A little important | 1 |
| Somewhat important | 10 |
| Very important | 250 |
3. Looking at how each of your answers satisfied the other’s preferences, they use these values to give correct weights to the calculations. Your match percentage with other person is figured by answering the following two questions:
a) How much did other person’s answer make you happy?
b)How much did your answers make the other person happy?
Examples of matches
Let us understand how this works with the help of an example.
We shall consider two users: user A and user B and try to find match percentage between them.
Say for instance the question that has been answered by both A and B is:
How messy are you?
The answer options are:
1. Very messy
2. Average
3. Very organized
| A's answer | Very organized |
| How A wants someone else to answer | Average or very organized |
| The question's importance to A | Very important |
| B's answer | Average |
| How B wants someone else to answer | Average |
| The question's importance to B | A little important |
Have you ever cheated in a relationship?
The answer options are:
1. Yes
2. No
| A's answer | No |
| How A wants someone else to answer | No |
| The question's importance to A | A little important |
| B's answer | Yes |
| How B wants someone else to answer | No |
| The question's importance to B | somewhat important |
How much did B's answer make A happy?
A indicated that B’s answer to the first question was very important to you. And that his answer to the second question was not. So we placed 250 importance points on the first question and 1 point on the second question. Of those 251 possible points, B earned 250 by answering the first question how A wanted. So B’s answers were 250/251 = 99.6% satisfactory for A.[4]
How much did A's answer make B happy?
Well, B placed 1 importance point on A's answer to the first question and 10 on A's answer to the second. Of those 11 possible points, A earned 10 points. So A's answers made B 10/11 = 91% happy.
To get a match percentage for A and B, they just multiply your satisfactions, and then take the square root: sqrt(91% * 99.6%) = ~95%.
But to eliminate the possibility where both A and B just answered one same question and got the answers right to each other's question; they would be matched 100% even though they practically know nothing about each other, OkCupid uses a reasonable margin of error which is calculated as 1/(size of number of questions answered by both). It believes that True Match = Calculated Match +/- Reasonable Margin of Error. To give users the most confidence in the match process, they always publish the lowest possible percentage your match can be. In this example, that would be 45%(95%-(1/2)*100%).
What is Weka?
Weka is a collection of machine learning algorithms for data mining tasks. The algorithms can either be applied directly to a dataset or called from your own Java code. Weka contains tools for data pre-processing, classification, regression, clustering, association rules, and visualization. It is also well-suited for developing new machine learning schemes. Weka is open source software issued under the GNU General Public License.[5]
Weka can be downloaded from here.
Methodology
Crawling data from OkCupid's website
Since OkCupid's data is not publicly accessible, I was trying to write a website crawler to scrape data from the OkCupid website. Several issues that I ran into were: OkCupid maintains a dynamically changing html structure which did not allow me to extract elements statically by referencing them through the html hierarchy; I can only see other user profiles answers for questions that I have answered myself (To overcome this issue, I tried to create an automatic form-filling bot which worked fine but with a few limitations). After several failed attempts at being able to perfectly extract questions and answers from the other users' profiles, I ran into a GitHub project which had created an OkCupid scraping bot written in Python based Scrappy. The project can be accessed here.
Trying to extract the amount of data required would take around 10 computers to run the bots on their systems. Because of time and resource constraints, I tried and then decided against running them on different systems with different fake profiles. Instead, I contacted the authors and luckily managed to get a reply from them. They graciously sent me the passwords for the encrypted user data set as well as the question data set.
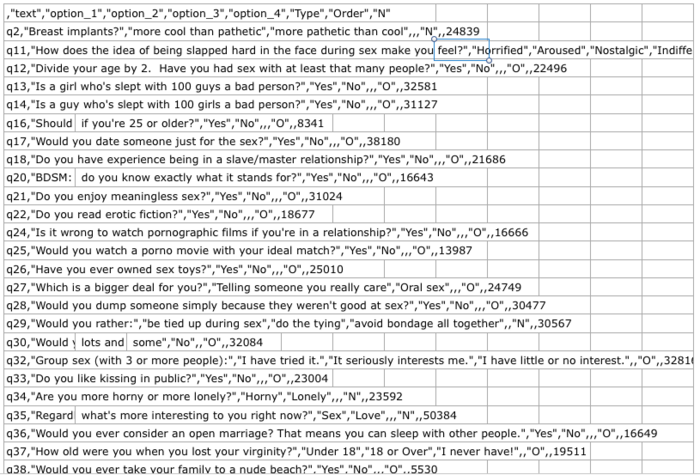
The question data set has all the questions as its instances and the attributes are the options of each question. A part of the question data set has been shown in the screenshot below:
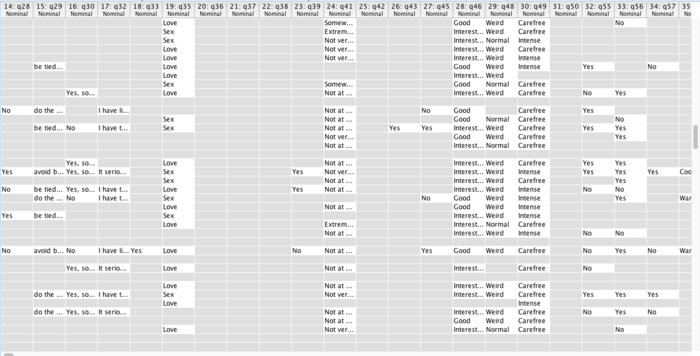
A very small part of the user data set has been shown in the screenshot below:
The attributes are the questions that users have answered and the rows correspond to answers by each user to those questions.
K means clustering
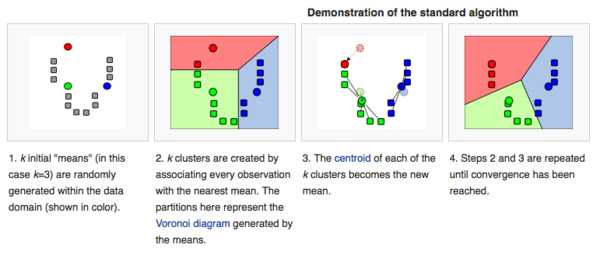
K-means clustering is a method of vector quantization, originally from signal processing, that is popular for cluster analysis in data mining. k-means clustering aims to partition n observations into k clusters in which each observation belongs to the cluster with the nearest mean, serving as a prototype of the cluster.[6]
It is easy to visualize how K-means algorithm works as shown in this image taken from Wikipedia.
Since the objective of my project is to cluster the population into segments and find a representative of that segment which represents that cluster well, K-means serves my purpose.
The instances, i.e. the cases that I need to cluster are the answers of users and the attributes I am clustering on (i.e. trying to model their behavioural attributes) are the questions answered by a majority of the population.
Training
Since there are no actual labels we can use, clustering these instances(user profiles) according to attributes(questions) is actually an unsupervised learning task. I experimented with density based clustering and K-means clustering. K-means clustering gave me better outcomes. On Weka, the process can be shown as following:
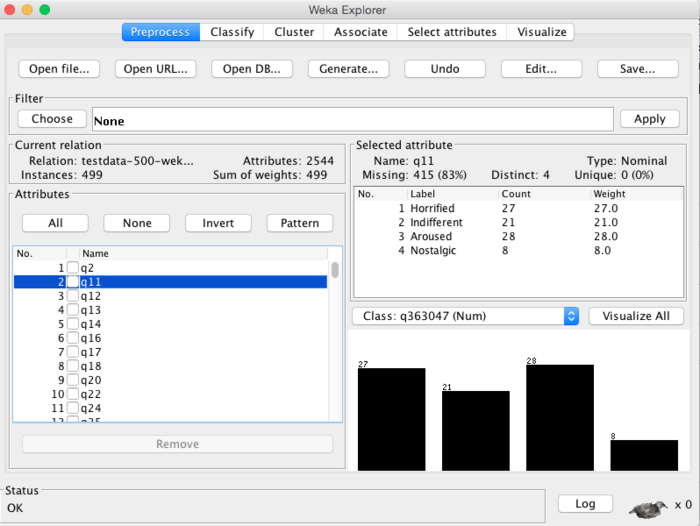
- Preprocessing the data: removing unwanted attributes. I ran the experiments choosing only the four most popular attributes (q34113, q85419, q416235, q20062),i.e. choosing those questions which have been answered by all the users (having 0% missing data)
The preprocessing of data is shown as follows:
I select the four attributes from the left pane and remove the rest of the attributes, and then i click on the cluster tab to perform k-means clustering on this selected data.
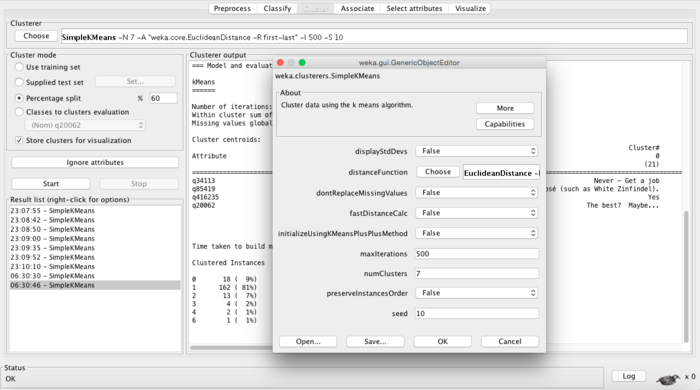
- Setting the K-means clustering parameters. I use 80-20% split, i.e 80% of the data is used to train the model and 20% is used to test the model. Playing around with different number of clusters, I decided to choose 4 as each cluster had enough elements to validate its existence.
The K-means attribute selection pane in Weka where I choose the attributes is shown as follows:
Cluster Visualization
Number of iterations: 2
Within cluster sum of squared errors: 75.0
The most popular attributes are found to be: q34113, q85419, q416235 and q20062.
- q34113: How do you feel about government-subsidized food programs (free lunch,food stamps etc)?
Options are: No problem, It's okay if it is not abused, Okay for short amounts of time, Never-get a job
- q85419: Which type of wine would you prefer to drink outside of a meal such as for leisure?
Options are: White (such as Chardonnay Riesling), Red(such as Merlot Cabernet Shiraz), Rosé (such as White Zinfindel), I don't drink wine.
- q416235: Do you like watching foreign movies with subtitles?
Options are: Yes, No, Can't answer without a subtitle.
- q20062: While in the middle of the best lovemaking of your life, if your lover asked you to squeal like a dolphin, would you?
Options are: Absolutely, No way, The best? Maybe...
Cluster centroids:
| Attribute | Cluster 0 | Cluster 1 | Cluster 2 | Custer 3 |
|---|---|---|---|---|
| q34113 | Never-get a job | It's okay, if it is not abused | No problem | It's okay, if it is not abused |
| q85419 | Rosé (such as White Zinfindel) | Rosé (such as White Zinfindel) | Red(such as Merlot Cabernet Shiraz) | Rosé (such as White Zinfindel) |
| q416325 | Can't answer without a subtitle | Can't answer without a subtitle | Can't answer without a subtitle | Yes |
| q20062 | The best? Maybe... | The best? Maybe... | The best? Maybe... | The best? Maybe... |
| Clustered Instances Cluster0: 79% |
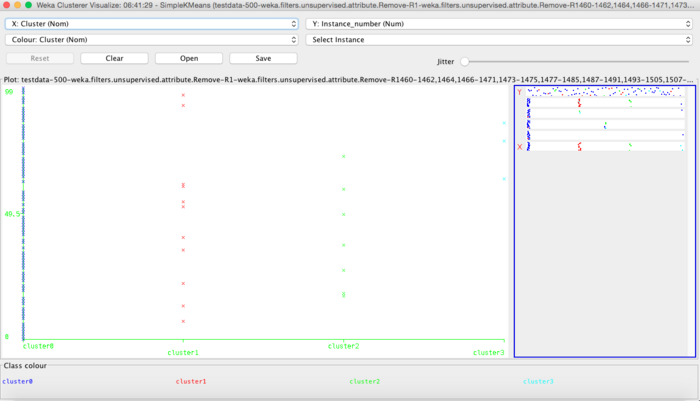
The clusters can be visualized below.
Clustering with 31 most popular attributes
In these set of experiments, I consider 31 most popular attributes which have missing data < 34%. The attributes are as follows:
q35: Regardless of future plans, what's more interesting to you right now, love or sex?
q41: How important is religion/God in your life?
q46: Would you prefer good things happened or interesting?
q48: Which would you rather be? Normal or weird?
q49: Which word describes you better? Carefree or intense?
q70: Do you think homosexuality is a sin? yes or no?
q77: How frequently do you drink alcohol?
q79: What's your relationship with marijuana?
q123: Would you strongly prefer to go out with someone of your own skin color/ racial background?
q325: Would you consider having an open relationship (i.e. one where you can see other people)?
q403: Do you enjoy discussing politics?
q501: Have you smoked cigarette in the last six months?
q553: Do spelling mistakes annoy you?
q997: Are you a cat person or a dog person?
q1440: Is jealousy healthy in a relationship?
q1597: Would you consider sleeping with someone on the first date?
q4018: Are you happy with your life?
q9688: Could you date someone who does drugs?
q16053: How willing are you to meet someone from OkCupid?
q34113: How do you feel about government-subsidized food programs?
q64664: Do you think it is okay to open old graves to get more knowledge of ancient cultures and their history?
q85419: Which type of wine would you like to drink outside of a meal(such as for leisure)?
q179268: Are you either vegetarian or vegan?
q358077: Could you date someone who was really messy?
q358084: Do you enjoy intense intellectual conversations?
q416235: Do you like watching foreign movies with subtitles?
d_gender: Man, woman, transgender, transfeminine, agender
d_religion_type: Atheism, Agnosticism, Christianity, Judaism, Catholicism, Buddhism, Hinduism, Islam
d_smokes: No, yes, sometimes, trying to quit, when drinking
d_drinks: Socially, rarely, often, not at all, very often, desperately
q_20062: While in the middle of the best lovemaking of your life if your lover asked you to squeal like a dolphin, would you?
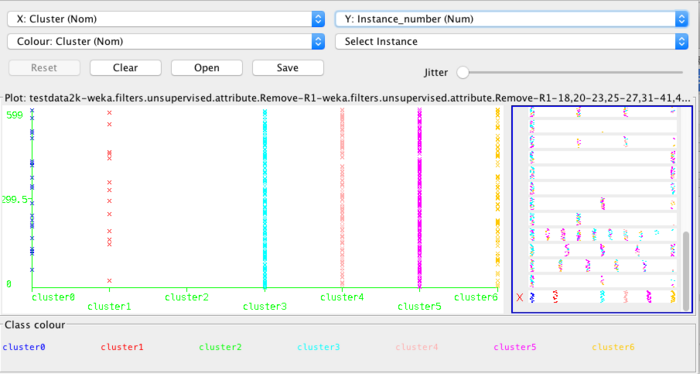
The clustering visualization is shown below. Cross validation gives us k of size 7 as shown below.
Clustered instances:
| Cluster 0 | 4% |
|---|---|
| Cluster 1 | 2% |
| Cluster 2 | 0% |
| Cluster 3 | 28% |
| Cluster 4 | 21% |
| Cluster 5 | 31% |
| Cluster 6 | 12% |
Comparison for some attributes on clusters 4, 5, 6:
| Question | Cluster 4 ans | Cluster 5 ans | Cluster 6 ans |
|---|---|---|---|
| Regardless of future plans, what is more important to you right now, love or sex? | Love | Love | Love |
| How important is religion/God in your life? | Not important | Not important | Not important |
| Would you prefer good things happened to you or interesting things? | Good | Good | Interesting |
| Which would you rather be, normal or weird? | Normal | Weird | Weird |
| Which describes you better, intense or carefree? | Carefree | Intense | Carefree |
| What's your relationship with marijuana? | Never | Missing | Occasionally |
| What do you prefer, cats or dogs or both? | Dogs | Dogs | Both |
| Would you consider having an open relationship? | No | No | Yes |
Results
We see that the clustering is heavily skewed towards the first cluster, i.e. cluster 0 which means to say that a large segment of the population feels that you should get a job instead of relying on government-subsidized food programs.Another interesting observation that can be made is that 97% of the online-dating population has a sense of humour. I say this because the response to ,'Do you like watching foreign movies with subtitles?' is almost unanimously answered as 'I can't answer without a subtitle'.
Broadly, it is safe to say that the online dating community is highly divided on how they feel about government-subsidized food programs.
To get higher match rates: firstly, it is important to answer the most popular questions and secondly, it is crucial to answer them how the majority in your desired cluster answers them. For instance if you feel, you would like to date someone from cluster 0; you must definitely answer the 4 most popular questions: q34113, q85419, q416235 and q20062 as 'Never get a job', 'Rose'(such as White Zinfindel)','Can't answer without a subtitle','The best? Maybe...' respectively. This would in expectation match you with someone from the same cluster with a minimum match percentage of 75%.
Match percentage would be 100% if you answered exactly this and this is what they wanted in their answers which is likely to be the same as the one they have answered (human psyche is bent towards liking options which it itself agrees with). Since I have chosen only 4 most popular attributes for my model here; assuming that you answer only these 4 questions; your calculated match percentage would be 100%. Your true match percentage, however will be calculated as: True Match = Calculated Match +/- Reasonable Margin of Error.
Reasonable margin of error=100%/4 (since you have 4 questions in common)=25%.
Therefore the true match would actually be 100-25=75%.
For increasing the match rate to 90%(as stated in the hypothesis), I would need to select 10 most popular attributes.
In my next set of experiments, I chose 31 attributes, which gives me 7 clusters. We calculate the true match rate as 100-(100/31)%=100-3.22%=96.78% which is greater than 90% as proposed in the hypothesis. Therefore I have clustered the dating population into 7 clusters based on the 31 most popular attributes and I claim that answering the questions based on the mean cluster answers for each cluster would get a user match rate higher than 90% for that cluster.
Discussion and Future Work
There are various possible directions this project could be extended in. I am currently in talks with the Emil O.W. Kirkegaard and his co-authors of the paper[3] The OKCupid dataset: A very large public dataset of dating site users to look into the possibility of developing the problem as a recommendation systems problem and developing/improving upon OkCupid's current algorithms for recommending matches to users. I was also interested in doing a country based comparison in online-dating trends to analyze how culture affects online-dating(concerning factors like religion, marriage, food etc). Essentially, we have a huge dataset of the online dating world and there are immense opportunities for collaboration with sociologists to find or validate interesting hypothesis.
