File:Demand fre microeconomicswiki 2022.png

Size of this preview: 800 × 587 pixels. Other resolutions: 2,560 × 1,877 pixels | 3,387 × 2,484 pixels.
Original file (3,387 × 2,484 pixels, file size: 305 KB, MIME type: image/png)
Summary
| Description | English: This graph illustrates the demand for rice in a hypothetical market. The horizontal axis represents the quantities or pounds of rice, and the vertical axis represents the price per pound. In this market, each price has an associated quantity of rice demanded. |
| Date | 26 August 2022 |
| File source | Own Work |
| Author | TATIANAZARATEBARRERA |
Licensing
|
File history
Click on a date/time to view the file as it appeared at that time.
| Date/Time | Thumbnail | Dimensions | User | Comment | |
|---|---|---|---|---|---|
| current | 00:23, 28 August 2022 | | 3,387 × 2,484 (305 KB) | TATIANAZARATEBARRERA (talk | contribs) | color |
| 22:45, 26 August 2022 | 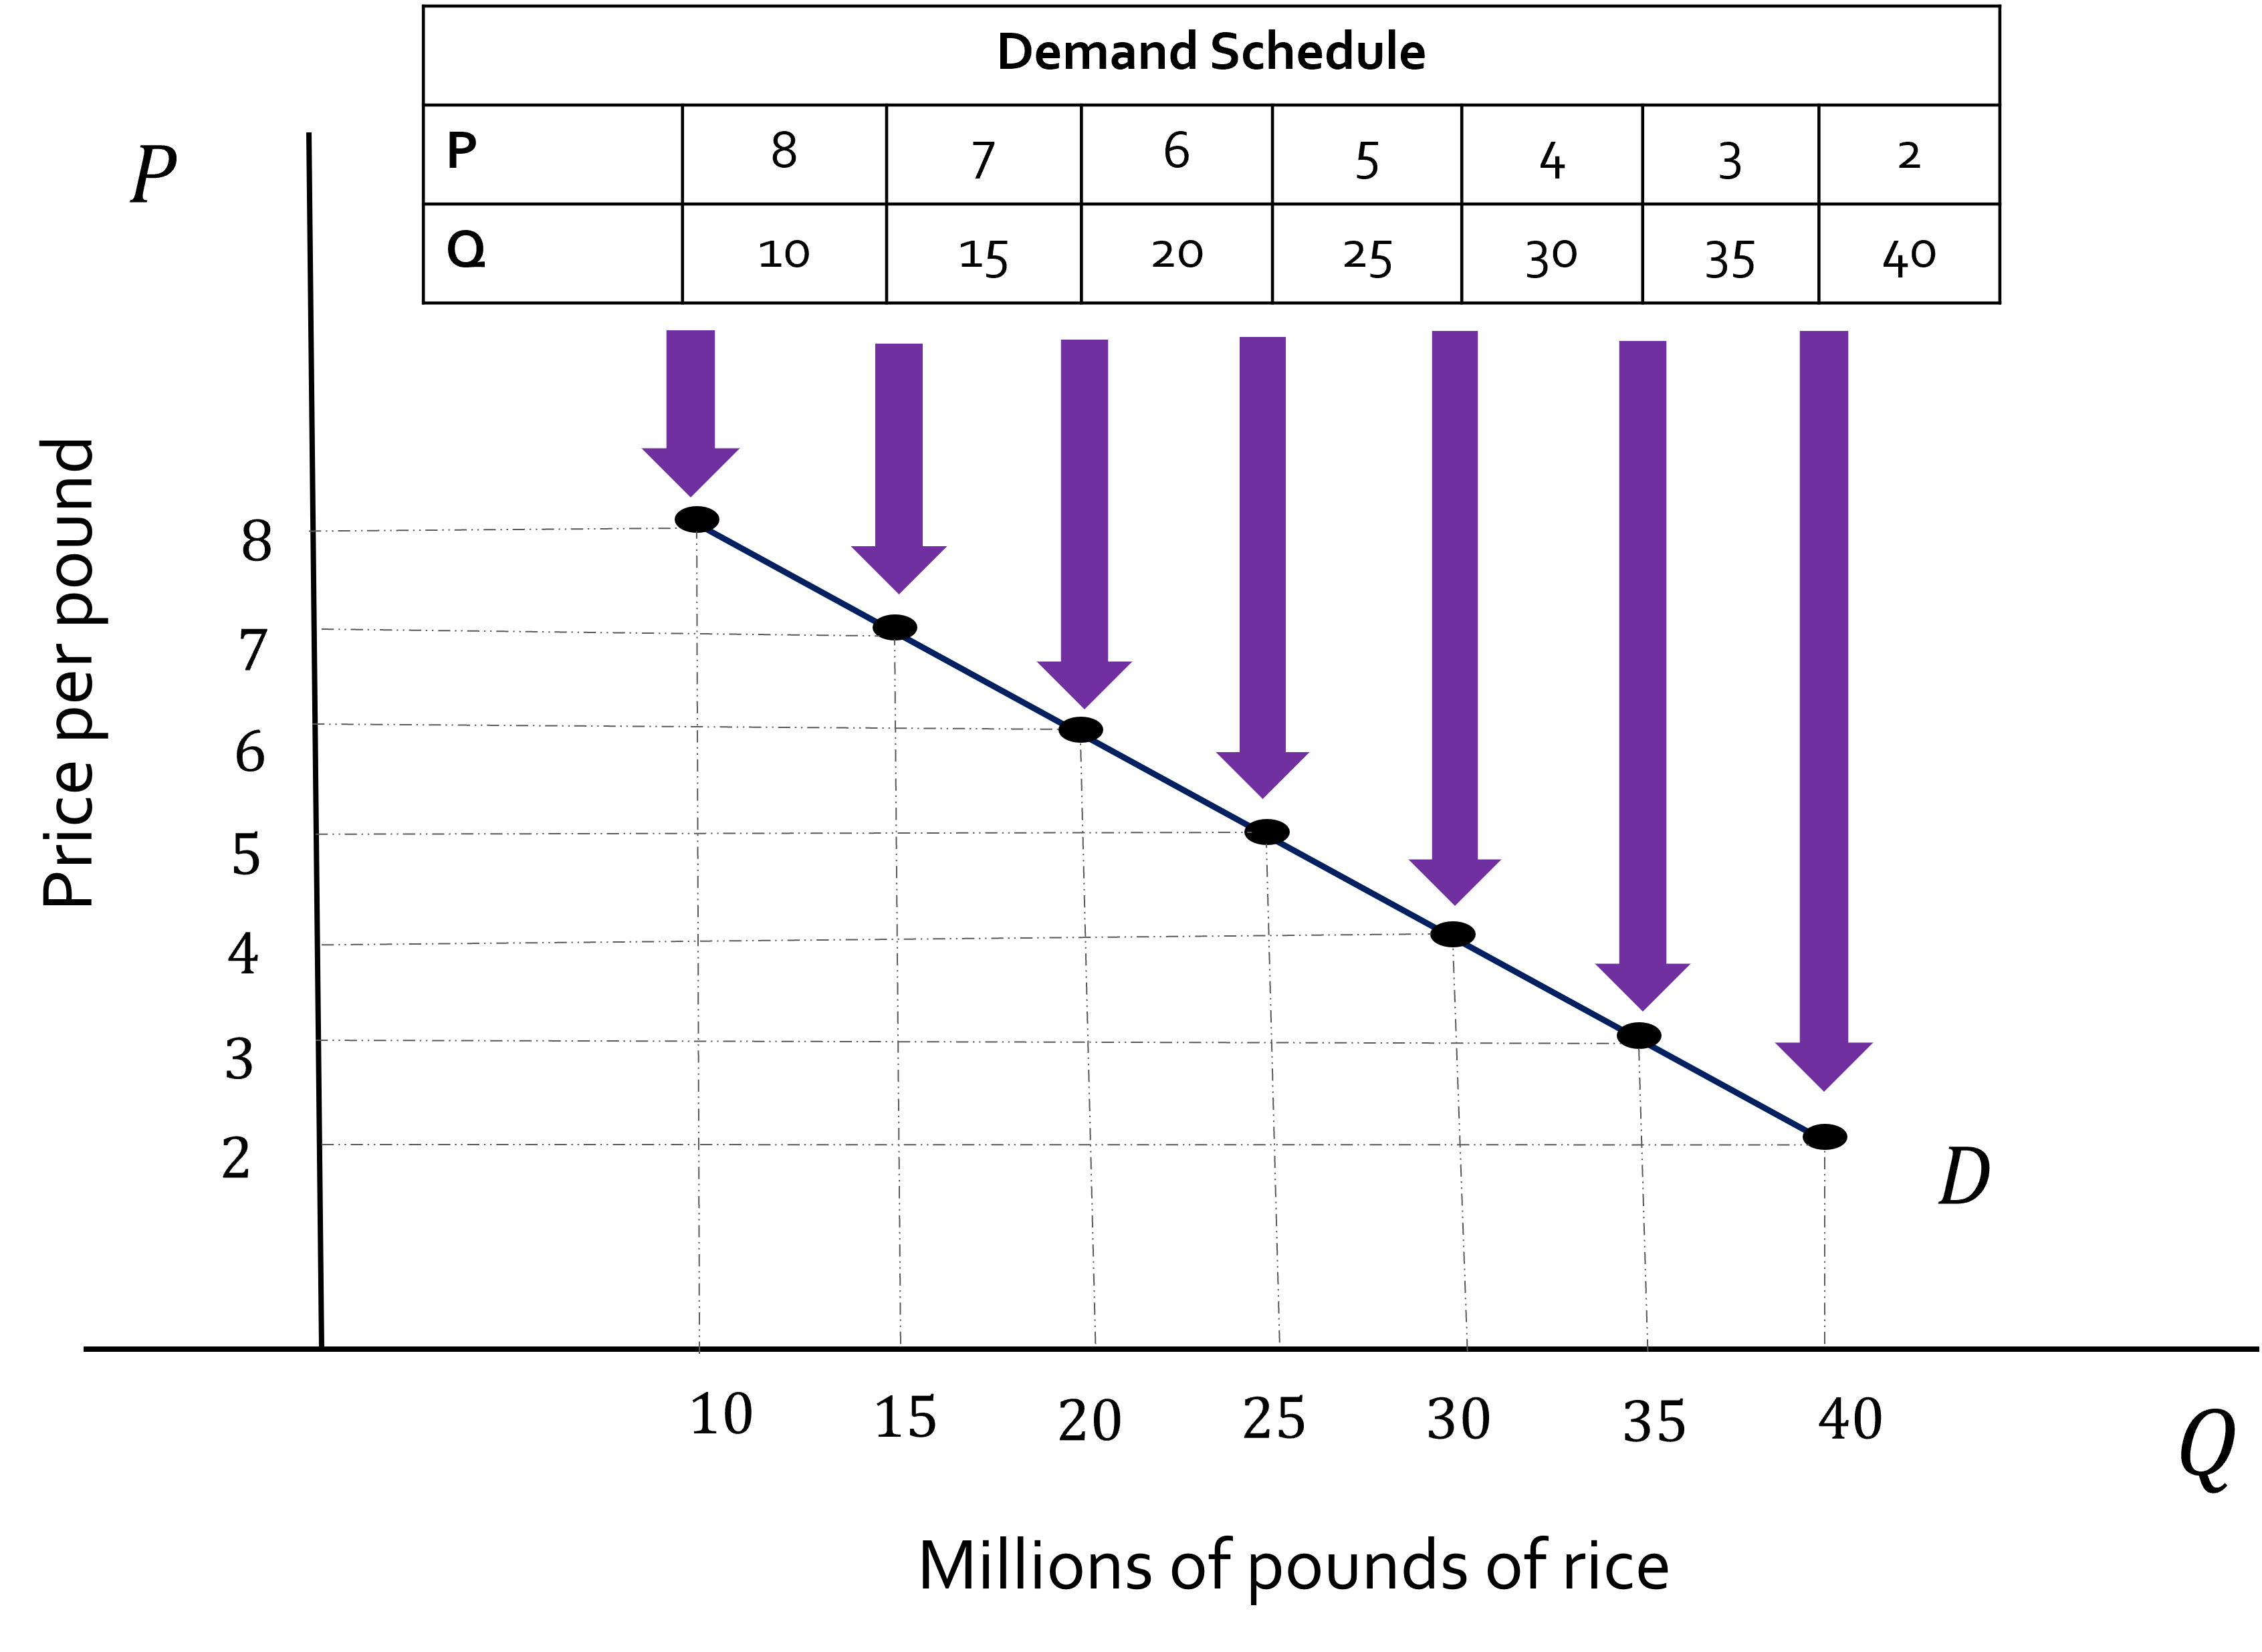 | 3,383 × 2,471 (187 KB) | TATIANAZARATEBARRERA (talk | contribs) | Horizontal | |
| 22:14, 26 August 2022 | 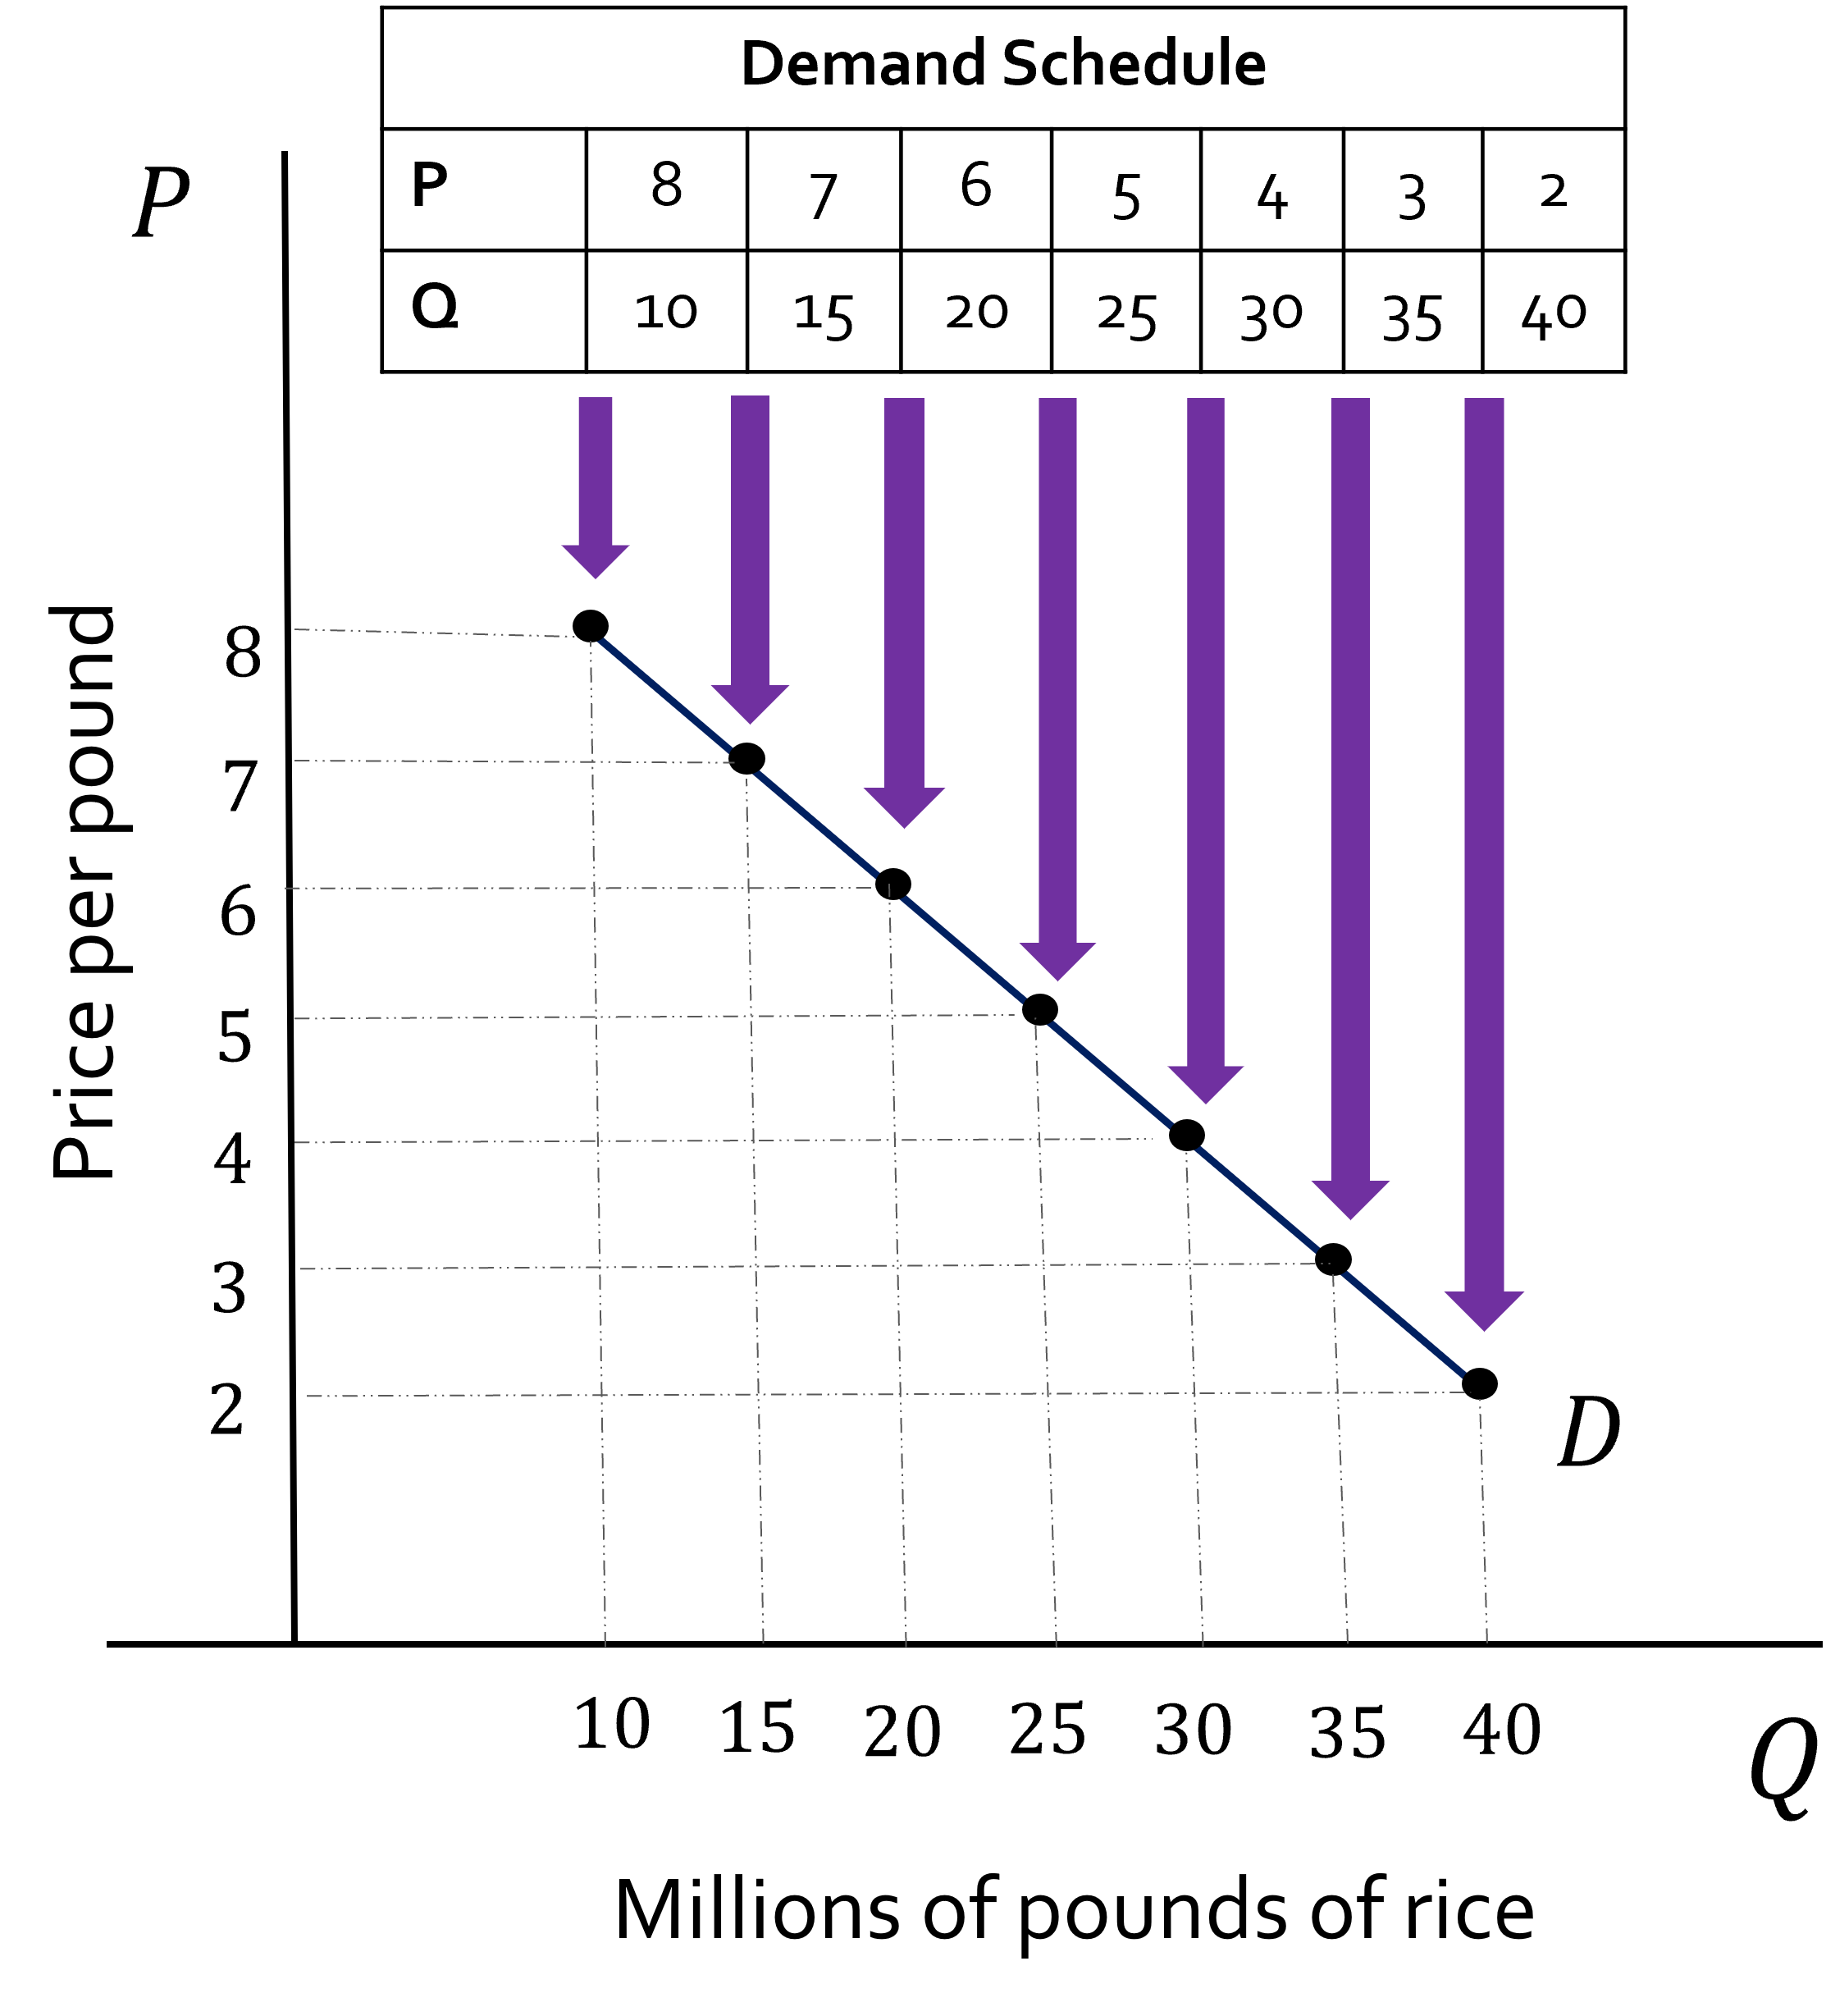 | 2,226 × 2,457 (164 KB) | TATIANAZARATEBARRERA (talk | contribs) | ||
| 19:41, 26 August 2022 | 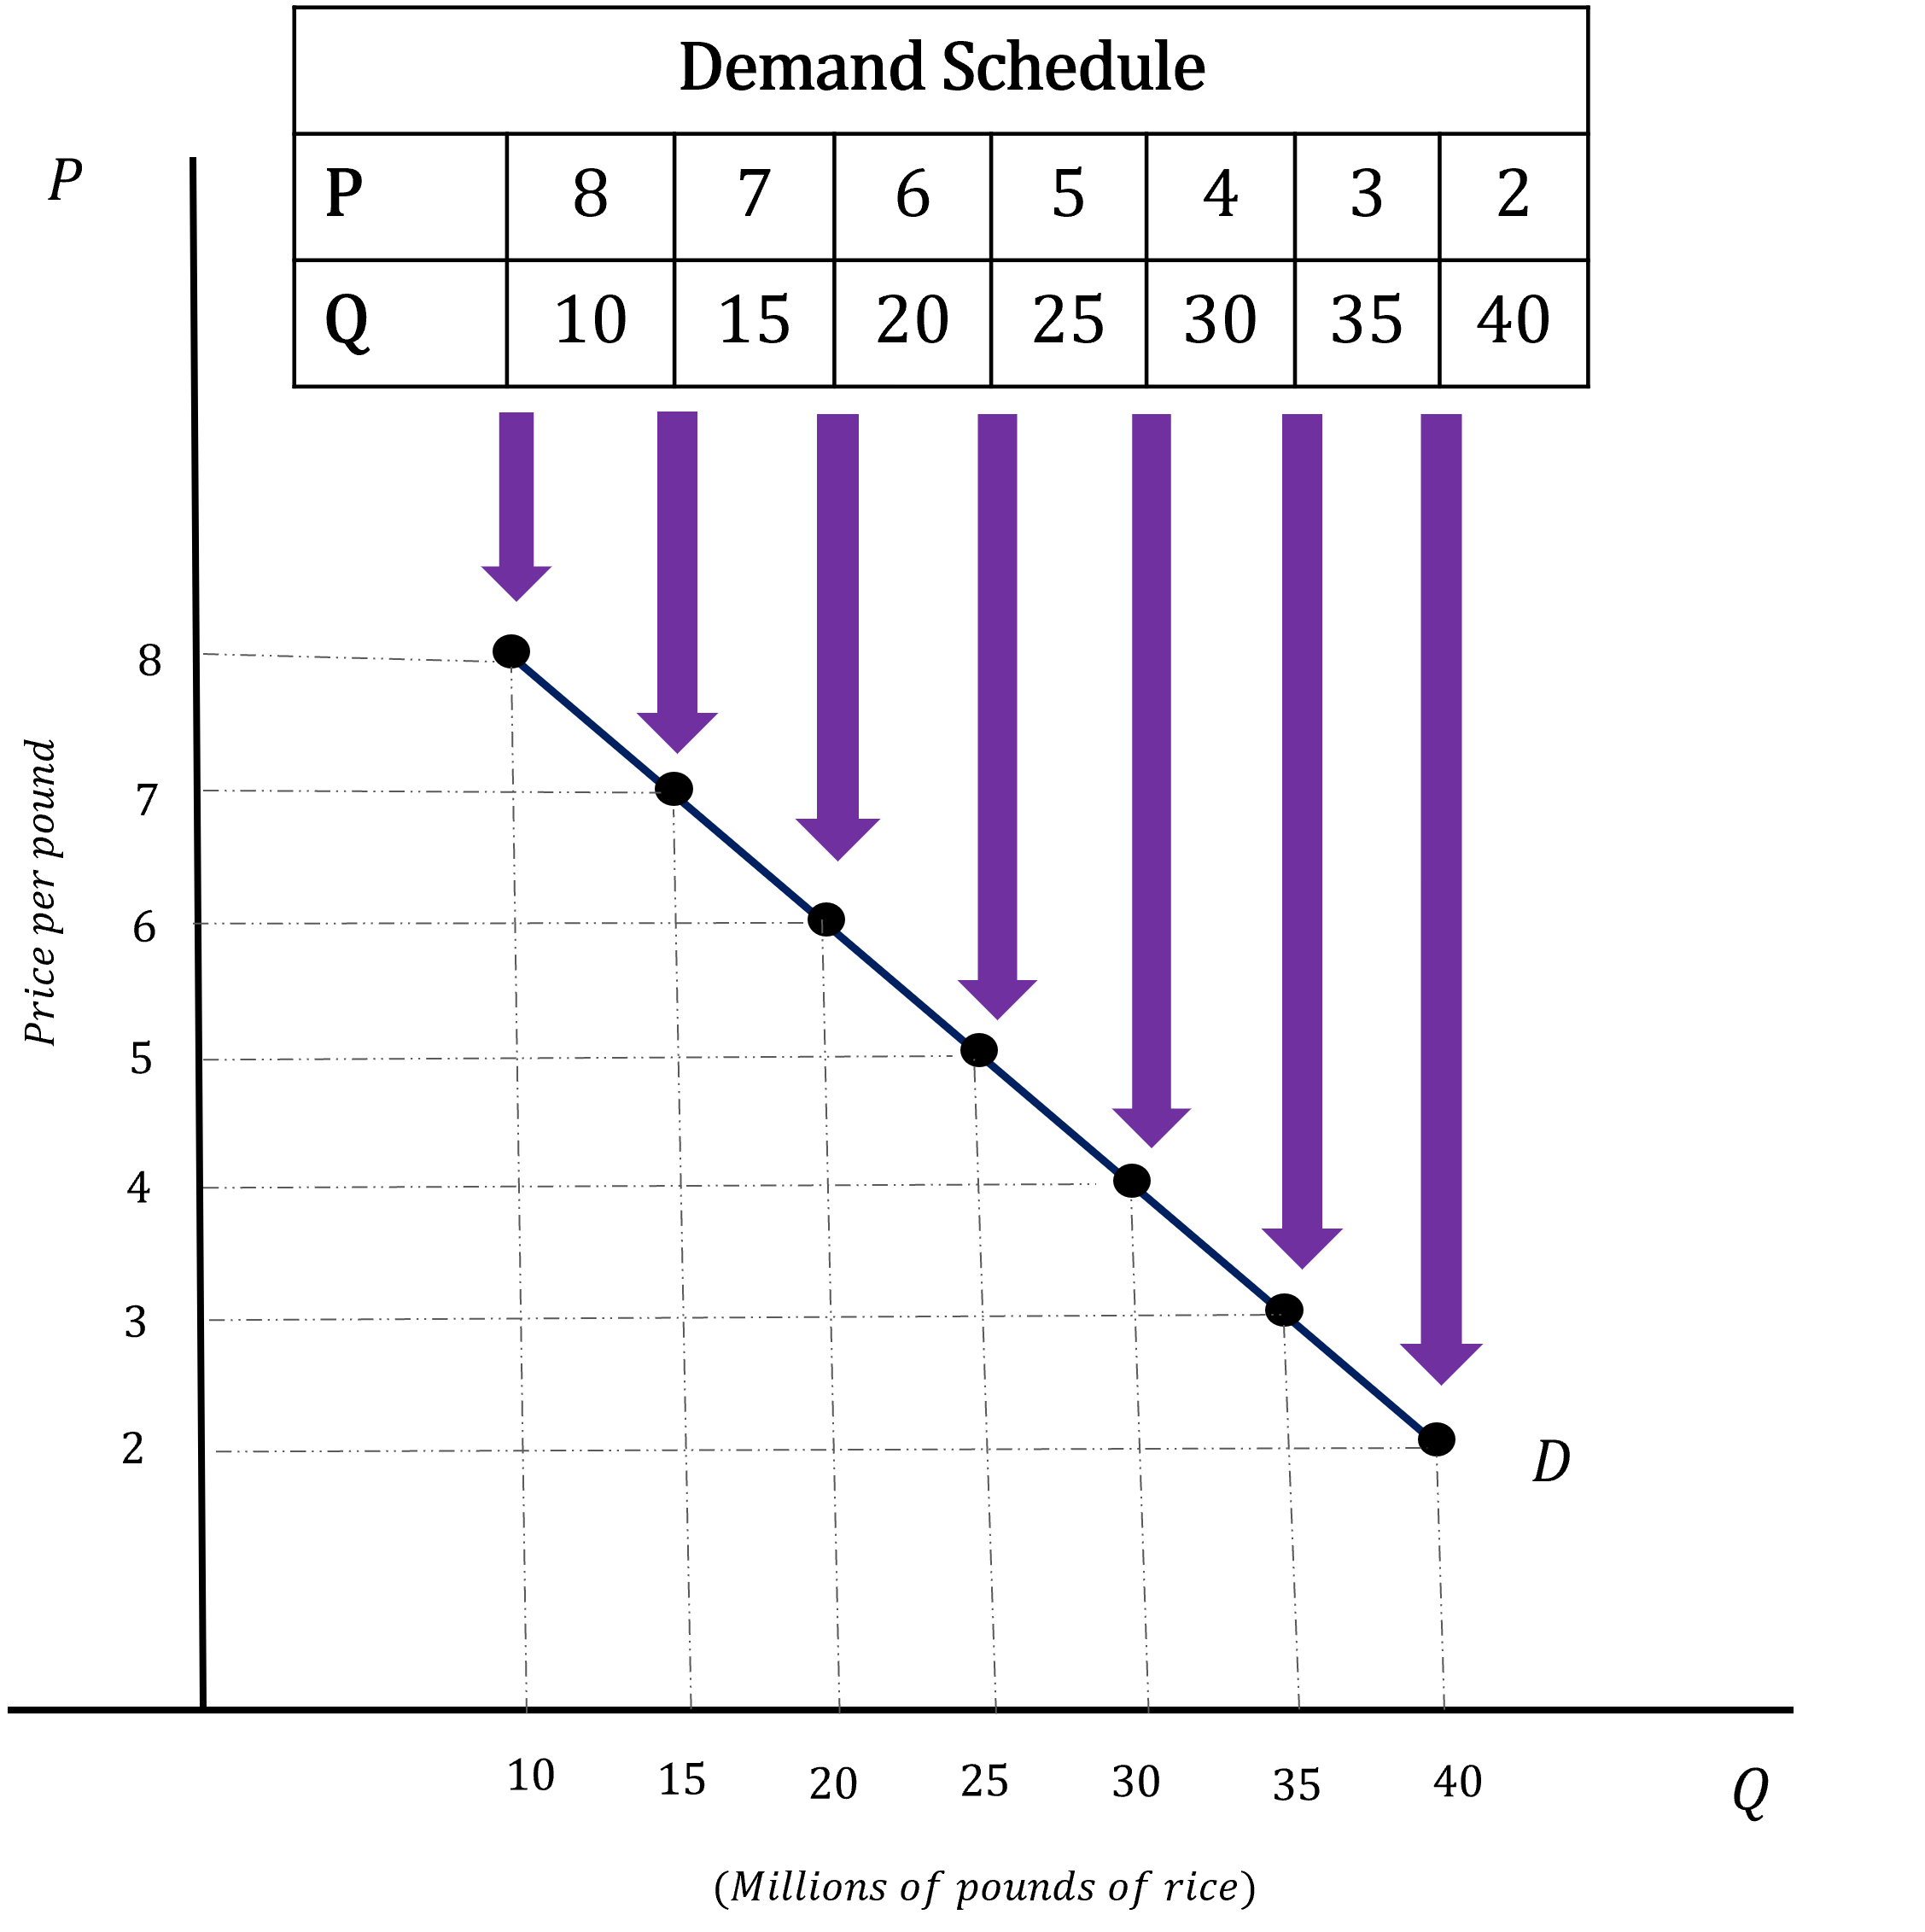 | 2,255 × 2,263 (143 KB) | TATIANAZARATEBARRERA (talk | contribs) | Uploaded own work with UploadWizard |
You cannot overwrite this file.
File usage
The following 2 pages use this file: