File:ACO convergence time versus network size.png
Size of this preview: 800 × 326 pixels. Other resolution: 2,325 × 948 pixels.
Original file (2,325 × 948 pixels, file size: 68 KB, MIME type: image/png)
Summary
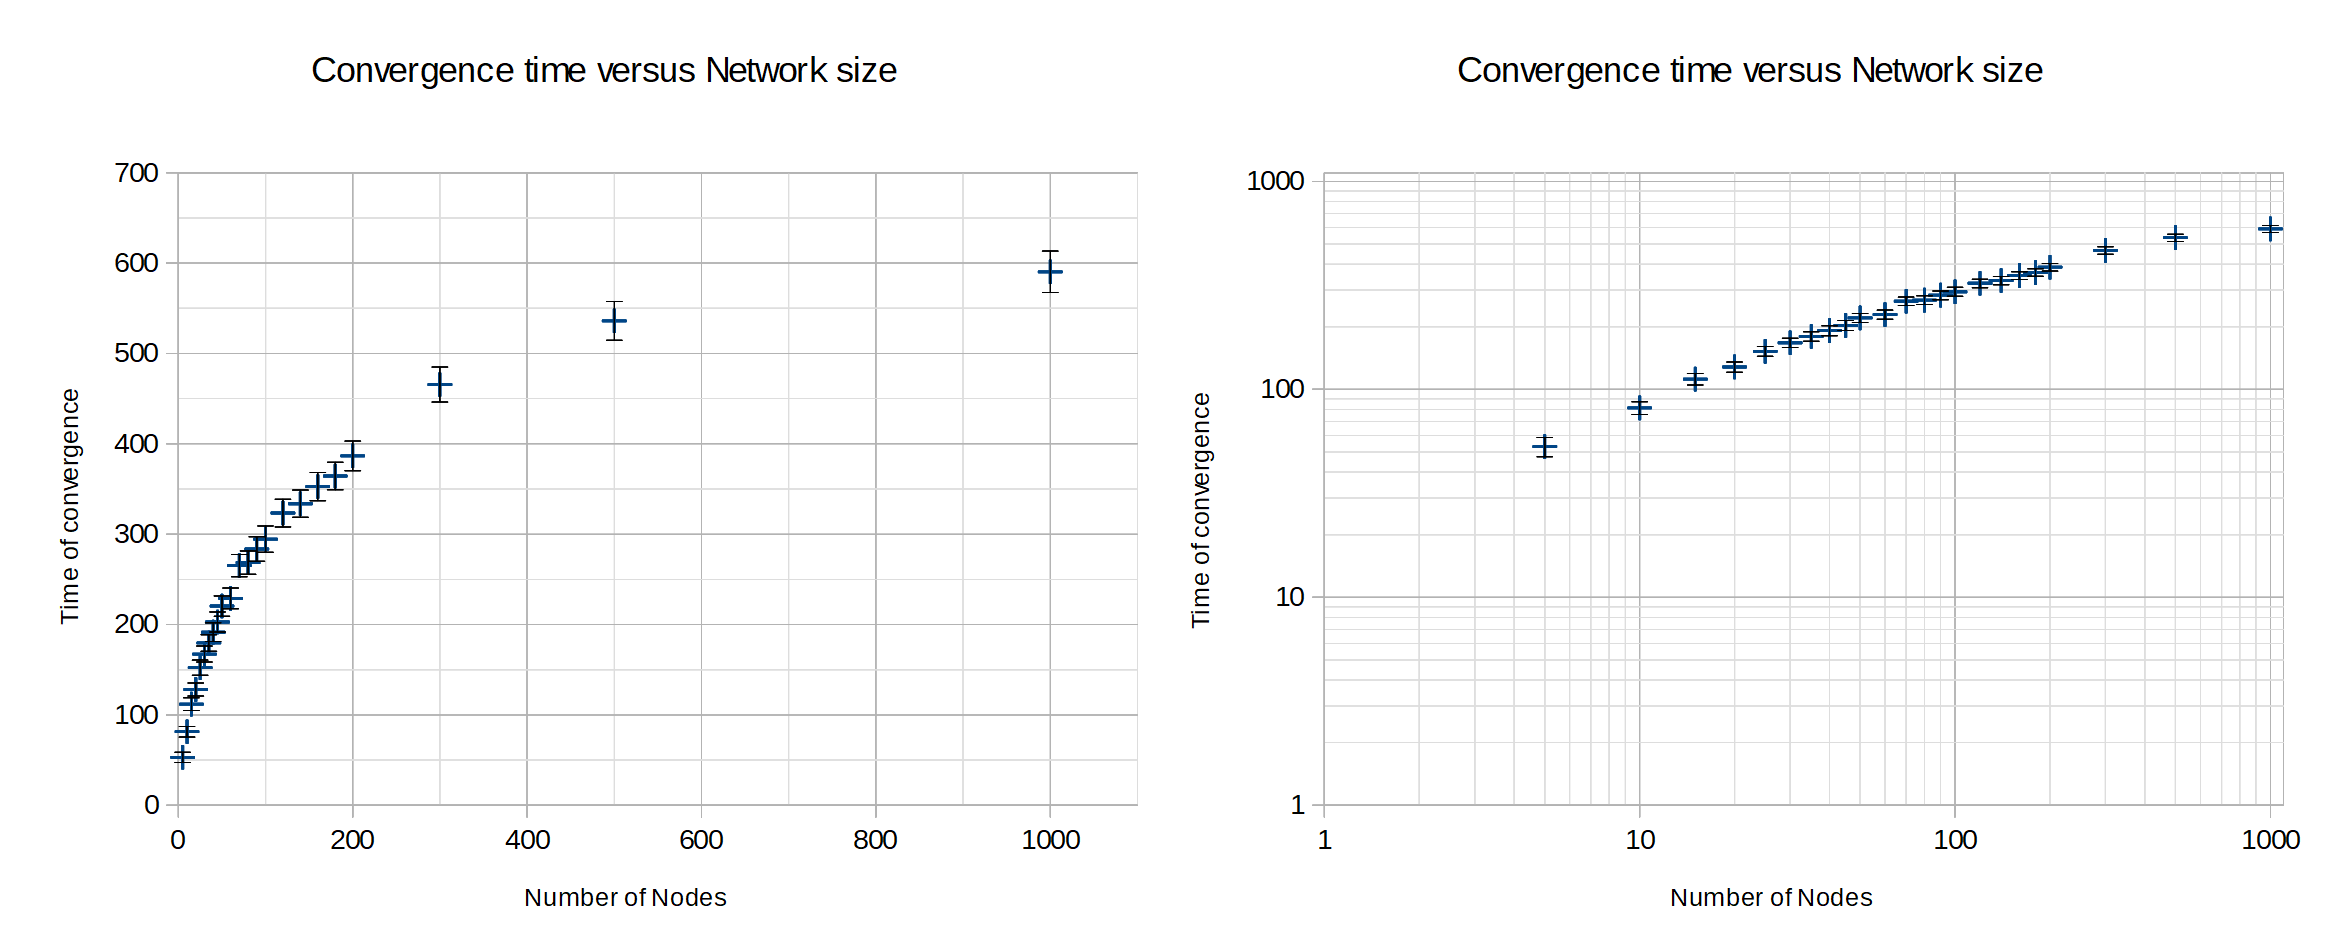
| Description | English: Plot of time taken to find the shortest path using Ant Colony Optimization in increasing network size. The graph on the left is on linear scale and the graph on the right is on log-log scale. We observe a logarithmic relation between the time of convergence and the network size. |
| Date | 20 April 2018 () |
| File source | Own Work |
| Author | Kumseok Jung |
Licensing
|
File history
Click on a date/time to view the file as it appeared at that time.
| Date/Time | Thumbnail | Dimensions | User | Comment | |
|---|---|---|---|---|---|
| current | 20:56, 20 April 2018 | 2,325 × 948 (68 KB) | KumseokJung (talk | contribs) | User created page with UploadWizard |
You cannot overwrite this file.
File usage
The following page uses this file: