Science:Math Exam Resources/Courses/MATH110/April 2019/Question 06/Hint 1
< Science:Math Exam Resources | Courses/MATH110 | April 2019 | Question 06(Redirected from Science:Math Exam Resources/Courses/MATH110/April 2019/Question 6/Hint 1)
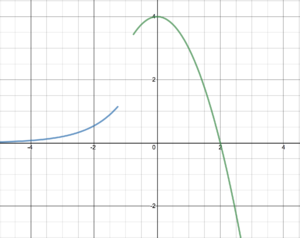
The first bullet point tells us what the function looks like for x small enough or large enough: g(x) has a horizontal asymptote as and it should look go down to as x increases. From the second bullet point, we can infer that g has a maximum at x=0. The graph of g away from x = -1 looks something like the graph of for and the graph of for .
A partial sketch is presented in figure 1. Note that there are many possible different sketches.


