File:Landscape transition curve.png

Size of this preview: 800 × 530 pixels. Other resolution: 864 × 572 pixels.
Original file (864 × 572 pixels, file size: 1.19 MB, MIME type: image/png)
Summary
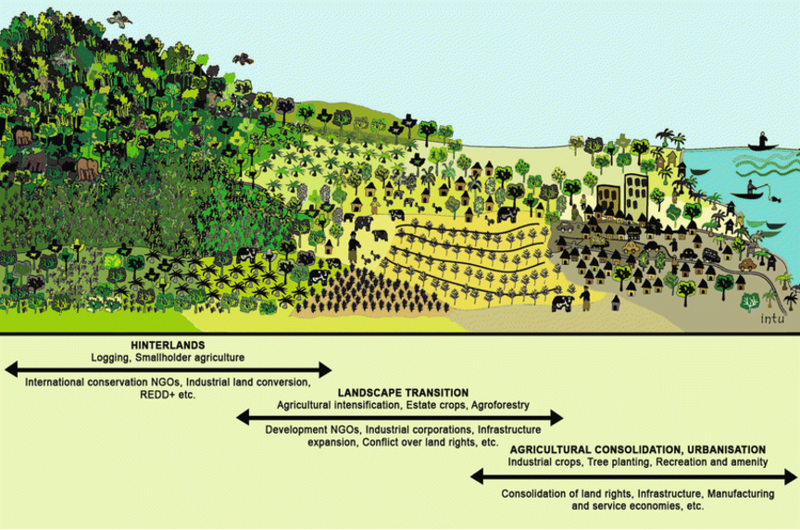
| Description | English: The diagram shows a spectrum of situations where landscape approaches are used. It shows generic changes in land cover and social processes as areas develop. Transitions occur when management intensity increases and infrastructure expands across development gradients from remote hinterlands to more developed regions. The key participants and the objectives that are pursued at different points on this trajectory are identified in the lower part of the figure |
| Date | 28 November 2016 |
| File source | https://link.springer.com/article/10.1007/s11625-016-0415-z |
| Author | Jeffrey A. Sayer, Chris Margules, Agni K. Boedhihartono, Terry Sunderland, James D. Langston, James Reed, Rebecca Riggs, Louise E. Buck, Bruce M. Campbell, Koen Kusters, Chris Elliott, Peter A. Minang, Allan Dale, Herry Purnomo, James R. Stevenson, Petrus Gunarso & Agus Purnomo |
Licensing
|
|
File history
Click on a date/time to view the file as it appeared at that time.
| Date/Time | Thumbnail | Dimensions | User | Comment | |
|---|---|---|---|---|---|
| current | 19:31, 16 April 2021 | | 864 × 572 (1.19 MB) | MeichenZhao (talk | contribs) | Uploaded a work by Jeffrey A. Sayer, Chris Margules, Agni K. Boedhihartono, Terry Sunderland, James D. Langston, James Reed, Rebecca Riggs, Louise E. Buck, Bruce M. Campbell, Koen Kusters, Chris Elliott, Peter A. Minang, Allan Dale, Herry Purnomo, James R. Stevenson, Petrus Gunarso & Agus Purnomo from https://link.springer.com/article/10.1007/s11625-016-0415-z with UploadWizard |
You cannot overwrite this file.
File usage
The following page uses this file: