File:Figure3 shift demand microwiki 2022.png

Size of this preview: 622 × 600 pixels. Other resolution: 2,023 × 1,950 pixels.
Original file (2,023 × 1,950 pixels, file size: 108 KB, MIME type: image/png)
Summary
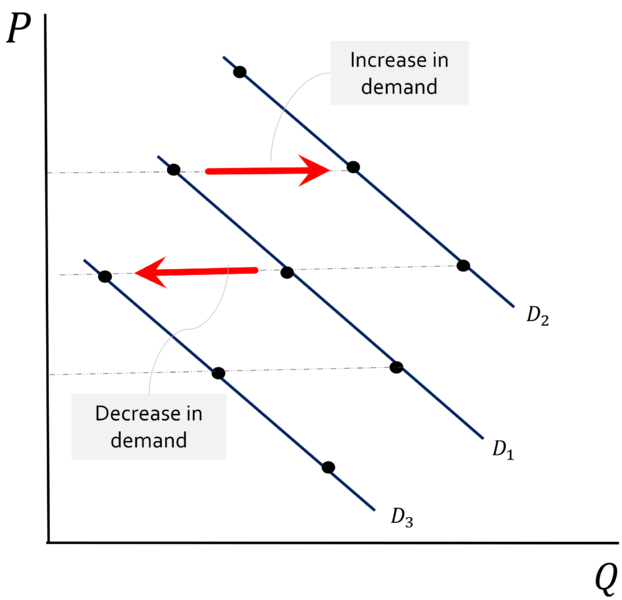
| Description | English: Figure 3 illustrates shifts in demand. Changes in demand for a good or service lead to a shift in the entire demand curve. |
| Date | 26 August 2022 |
| File source | Own Work |
| Author | TATIANAZARATEBARRERA |
Licensing
|
File history
Click on a date/time to view the file as it appeared at that time.
| Date/Time | Thumbnail | Dimensions | User | Comment | |
|---|---|---|---|---|---|
| current | 22:57, 26 August 2022 | | 2,023 × 1,950 (108 KB) | TATIANAZARATEBARRERA (talk | contribs) | reduce font size |
| 22:36, 26 August 2022 |  | 2,023 × 1,950 (135 KB) | TATIANAZARATEBARRERA (talk | contribs) | Uploaded own work with UploadWizard |
You cannot overwrite this file.
File usage
The following 2 pages use this file: