File:20201211 Billion dollar events related to climate change - U.S. -en.svg

From UBC Wiki

Original file(SVG file, nominally 1,200 × 675 pixels, file size: 4 KB)

This file is from Wikimedia Commons and may be used by other projects. The description on its file description page there is shown below.

Summary

Description
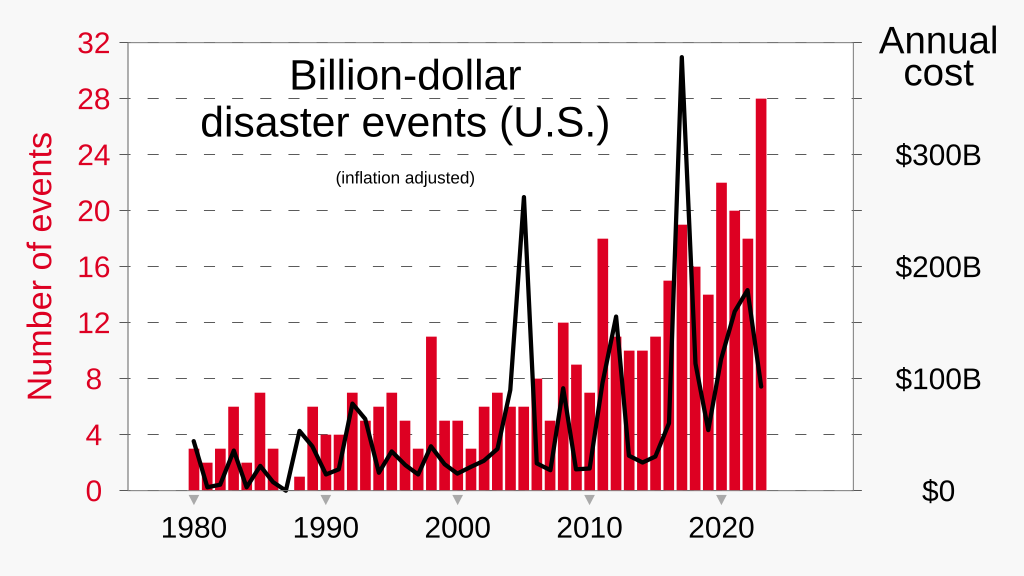
English: Graph of number billion-dollar climate-related events in the United States, and annual costs of those events, based on NOAA's National Centers for Environmental Information.
  • Versions 8 and 9 are updates through 2023.
Archive thereof: https://web.archive.org/web/20240113044752/https://www.ncei.noaa.gov/access/billions/time-series/US
  • Version 6 is an update through 2022.
Archive thereof: https://web.archive.org/web/20221231055639/https://www.ncei.noaa.gov/access/billions/time-series
  • Version 4 is an update through 2021, with sources:
Archive thereof: https://web.archive.org/web/20220111143455/https://www.ncei.noaa.gov/news/calculating-cost-weather-and-climate-disasters
  • Most XML code for Version 4 was made by the Column Chart and Horizontal Bar Chart spreadsheets at User:RCraig09/Excel to XML for SVG. Earlier versions were made with Inkscape.
  • Version 2 is an update through end of 2020, with source:
  • Version 1 upload is based on data through September 2020, indicated by the "+" above 2020's bar in bar chart.


  • Downloaded data listing is provided below.
Date
Source Own work
Author RCraig09

Source data

Data through 2023:

Click at right to show/hide data

Year — Disasters Count — Cost
1980 — 3 — 44.5
1981 — 2 — 3.4
1982 — 3 — 5.3
1983 — 6 — 35.5
1984 — 2 — 3.1
1985 — 7 — 21.8
1986 — 3 — 7.7
1987 — 0 — 0
1988 — 1 — 53.2
1989 — 6 — 39.4
1990 — 4 — 14.2
1991 — 4 — 19.2
1992 — 7 — 78
1993 — 5 — 64.2
1994 — 6 — 16.3
1995 — 7 — 34.7
1996 — 5 — 22.7
1997 — 3 — 14.8
1998 — 11 — 39.3
1999 — 5 — 23.8
2000 — 5 — 15.1
2001 — 3 — 21.3
2002 — 6 — 26.6
2003 — 7 — 37.5
2004 — 6 — 89.9
2005 — 6 — 262
2006 — 8 — 24.6
2007 — 5 — 18.4
2008 — 12 — 91.8
2009 — 9 — 19.3
2010 — 7 — 19.7
2011 — 18 — 95.9
2012 — 11 — 155.3
2013 — 10 — 31.6
2014 — 10 — 25
2015 — 11 — 30.2
2016 — 15 — 60
2017 — 19 — 386.7
2018 — 16 — 113.3
2019 — 14 — 54.1
2020 — 22 — 117.5
2021 — 20 — 159.9
2022 — 18 — 178.8
2023 — 28 — 92.9 (revised by 12 Jan 2024)


Licensing

I, the copyright holder of this work, hereby publish it under the following license:
w:en:Creative Commons
attribution share alike
This file is licensed under the Creative Commons Attribution-Share Alike 4.0 International license.
You are free:
  • to share – to copy, distribute and transmit the work
  • to remix – to adapt the work
Under the following conditions:
  • attribution – You must give appropriate credit, provide a link to the license, and indicate if changes were made. You may do so in any reasonable manner, but not in any way that suggests the licensor endorses you or your use.
  • share alike – If you remix, transform, or build upon the material, you must distribute your contributions under the same or compatible license as the original.

Captions

Graph of number billion-dollar climate-related events in the United States, and annual costs of those events, based on NOAA's National Centers for Environmental Information

Items portrayed in this file

depicts

12 December 2020

image/svg+xml

cfca2339efa0bc99535df2bc67d49af3c0939872

4,391 byte

675 pixel

1,200 pixel

File history

Click on a date/time to view the file as it appeared at that time.

Date/TimeThumbnailDimensionsUserComment
current04:54, 13 January 2024Thumbnail for version as of 04:54, 13 January 20241,200 × 675 (4 KB)wikimediacommons>RCraig09Version 9: revise to include data newly changed on NOAA website (25 ---> 28 events . . . . and $81.0B ---> $92.9B)