We will make a table outlining the information from part (a):

We will use this to create a similar table for f:

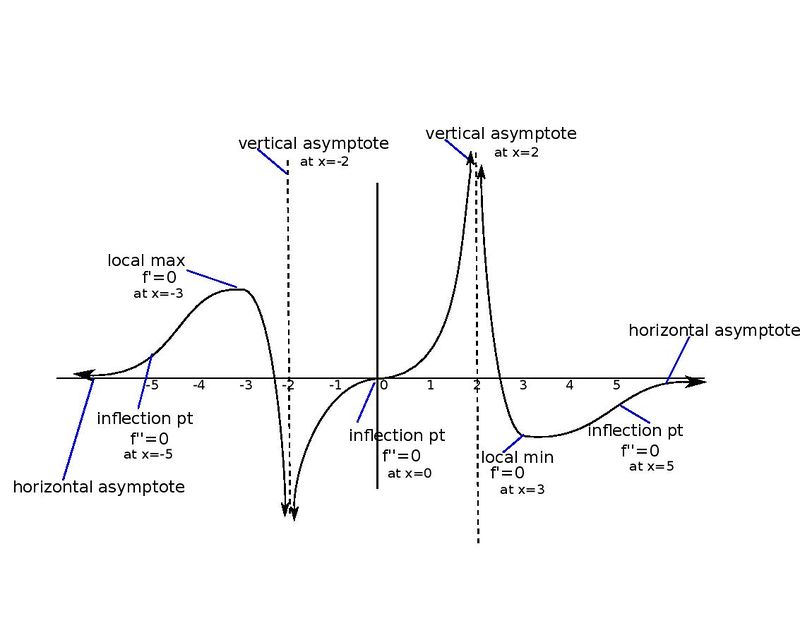
Note that this is consistent with inflection points at -5, 0, and 5, and with the fact that -3 is a maximum and 3 is a minimum.
We put the pieces together and arrive at the graph below: