File:Figure 4 .png
Size of this preview: 800 × 545 pixels. Other resolution: 1,244 × 848 pixels.
Original file (1,244 × 848 pixels, file size: 0 bytes, MIME type: image/png)
Summary
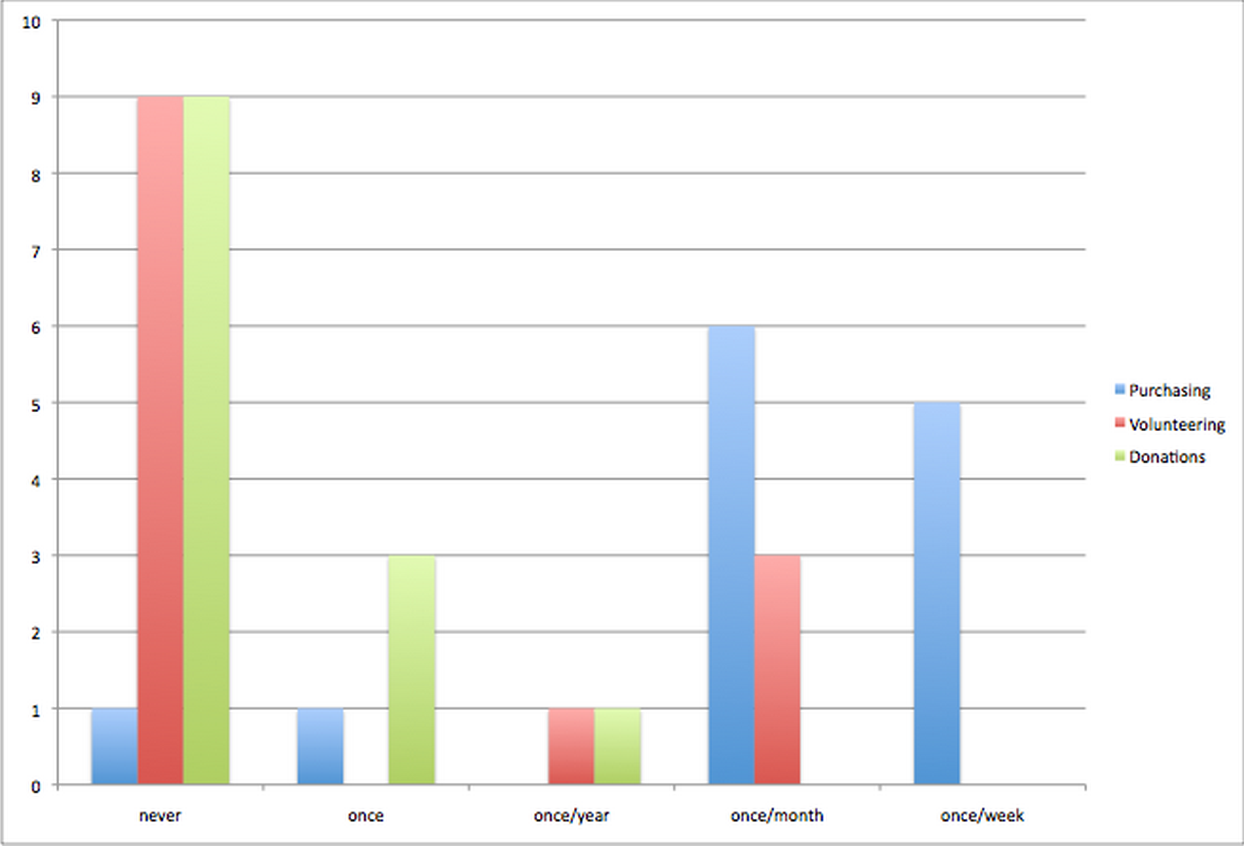
| Description | English: Figure 4: Answer distributions for Brewery population survey question 2: How often do you participate in the following activities that are related to the practise of urban farming? where n=13. The y-axis displays the number of respondents in each answer category. The x-axis displays the answer categories as were available to respondents when answering the survey. |
| Date | 4 December 2014 |
| File source | Own Work |
| Author | CorbinGirard |
Licensing
|
File history
Click on a date/time to view the file as it appeared at that time.
| Date/Time | Thumbnail | Dimensions | User | Comment | |
|---|---|---|---|---|---|
| current | 01:31, 5 December 2014 | | 1,244 × 848 (0 bytes) | CorbinGirard (talk | contribs) |
You cannot overwrite this file.
File usage
The following page uses this file: