Course:CPSC522/Improving the accuracy of Affect Prediction in an Intelligent Tutoring System
Improving the accuracy of Affect Prediction in an Intelligent Tutoring System
The idea is to use Logistic Regression with L1 regularization to select appropriate features for the binary classification problem explained in the Meta Tutor Study; which will then be used in various ensemble methods for increasing classification accuracy.
Principal Author: Md. Abed Rahman
This page is based on:
1.Predicting Affect from Gaze Data During Interaction with an intelligent Tutoring System-Natasha Jaques, Cristina Conati, Jason Harley, Roger Azevedo[1]
2.Feature selection, L1 vs. L2 regularization, and rotational invariance-Andrew Y. Ng[2]
3.Is Combining Classifiers with Stacking Better than Selecting the Best One?- SASO DZˇEROSKI, BERNAR DZˇENKO[3]
Abstract
The literature that was analyzed and evaluated with respect to predicting human emotions in the previous assignment speaks of the accuracy that is achievable with some classifiers such as Naive Bayes(NB), Random Forests(RF), Logistic Regression, Support Vector Machine(SVM) etc. The authors of Meta Tutor Study paper found these 4 classifiers useful for this particular application domain.[1] The primary goal is to modify the accuracy of prediction for both boredom and curiosity by using ensemble methods. Also, in the aforementioned paper, the authors used separate feature selection methods as number of data points were not large enough compared to the number of features. Instead making this a pre-processing step with increased time complexity, Logistic regression with L1 regularization can be employed to find the relevant features. The reasoning behind is the fact that logistic regression with L1 regularization exhibits a significantly higher tolerance to the presence of many irrelevant features.[2] This will make feature selection part of the classification problem itself. On the other hand, ensemble methods are known to be useful in improving test error. Trying ensembles on the reduced feature set might lead to significant improvement in performance. This page explores how these modifications work on the domain in question.
Builds on
The page builds on Predicting Affect of User's Interaction with an Intelligent Tutoring System ,Naive Bayes, Random Forests,Logistic Regression,Support Vector Machine, UBC's Machine Learning and Data Mining Course
Related Pages
Some related pages for this page would be the pages on WEKA, KAGGLE ENSEMBLING GUIDE, Wikipedia page on statistical significance
Content
Background
The Meta Tutor study, as mentioned before, used boredom and curiosity as representatives of the positive and negative spectrum of emotions and formulated it as two separate binary classification problems. The various denominations of boredom or curiosity was taken from the user with the help of a 5 point Likert scale[where 1 indicated “strongly disagree” and 5 indicated “strongly agree”]. One of the main contributions of this paper was generating meaningful feature sets from eye-gaze data which has been proved to be correlated to motivation in context of Intelligent Tutoring Systems(ITS). The authors also decided to threshold on the data where self reports of 3 and above was taken as emotion present and below that was taken as emotion absent;hence a binary classification problem was formulated.[1] Though it is known that there are various features that are of importance in such an environment; for a particular prediction, all of such features might not be particularly useful. In the dataset in question, data was collected from 67 undergraduate students with a variety of academic program concentrations. Though, the original dataset contained a number emotion labels obtained by self reporting, the authors extracted information to only work with boredom and curiosity. The processed dataset in question had 204 data entries and 158 features. Since, the number of features is substantially huge for a dataset with only 204 entries, feature selection techniques such as Principal Component Analysis (PCA) and Wrapper Feature Selection (WFS) were employed to reduce dimensionality of the classification problem.[1]
Hypothesis
As mentioned before, feature selection methods used in the MetaTutor study might lead to features that are not very interpretable. Again, using these is more of an intermediary step which leads to higher time complexity. Also, ensembles can be used to improve accuracy. The hypothesis explored in this page is that using Logistic Regression with L1 regularization to select appropriate features and using ensemble methods on the reduced featureset might result in significant improvement in performance in case of accuracy of prediction
Methodology
The dataset in question for this particular problem is divided for both emotions. This means, we process each of the emotions separately. In the Meta Tutor study, the data set had data collected over various periods of time called windows. These windows signified the amount of time data was collected from the user. Predictions were made on various window lengths ranging from ranging from 100% of the available data (14 minutes) to 1% (8 seconds). For both curiosity and boredom a window length of 100% gave the most accuracy. This can be attributed to the higher amount of data available for classifiers to work with. [1] To test this hypothesis, the data set containing the full window length was chosen. For classification, the WEKA workbench was used. A brief introduction of WEKA is as follows:
WEKA
WEKA is a collection of visualization tools for data analysis and predictive modeling. These algorithms are made easy to access with a graphical user interface. It also contains tools for data pre-processing, classification, regression, clustering, association rules, and visualization. WEKA gets it's name from a flightless, inquisitive bird, found in New Zealand. It has a number of different versions, including a stable version and a developer version[receives constant library update and bug fixes]. For testing this hypothesis, the developer version was used. Among the four aforementioned classifiers, NB and RF comes with the stable version. For SVM and Logistic regression with L1 regularization, the two well known developer libraries LIBSVM and LIBLINEAR were used.
Experimental Procedure
The hypothesis was tested by following the same procedure on both of the data sets[boredom and curiosity]. Each of the datasets contained 204 data points and 158 features. The datasets were pre-processed to have no missing values. Each missing value of an attribute was replaced by the mean of that particular attribute. A baseline accuracy was established by taking the ZeroR classifier which simply predicts the majority class as classification result. Then, the four pre-selected classifiers were used to get the classification accuracies for all attributes. Then, stacking was used as an ensemble method. Stacking is a model averaging technique where a couple of classifiers are used to find predictions on a certain dataset. These predictions are again used as features for another meta-classifier which is finally trained to get the final output. In order to compare with their non-stacked counterparts, four stacked classifiers were acquired by using each of the four aforementioned classifiers[NB, RF, LL1 and SVM] as the meta classifier. When one of those four classifiers were chosen as the meta classifier, the other three were used as the classifiers in the lower level. The reason behind keeping the same classifiers as either the meta classifier or the base classifier is to make sure that if performance gets better, it is due to ensembling itself; not due to the correlation between classifiers themselves. Moreover, another averaging ensemble method called 'voting' was used. Voting simply outputs the class which is predicted by most classifiers, i.e. majority voting. Then, each dataset's dimensionality was reduced by selecting the attributes that were selected to be relevant by LL1. Then, the aforementioned four classifiers were again used on the reduced dataset . Finally, the same stacking and voting methods mentioned previously were used on the reduced dataset. This gives a total of 5 different class of predictions which would later be used in analysis of prediction.
Results
The following shows the accuracy achieved by the various classifiers based on the set of features or type of classification method used.
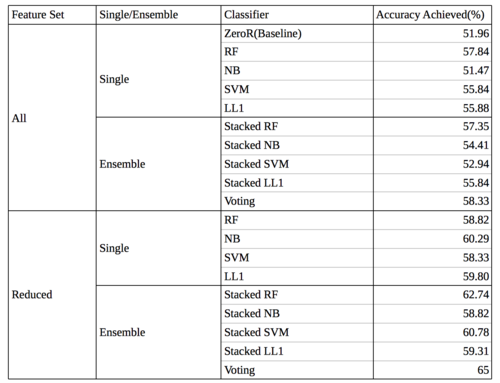
Accuracy for Boredom
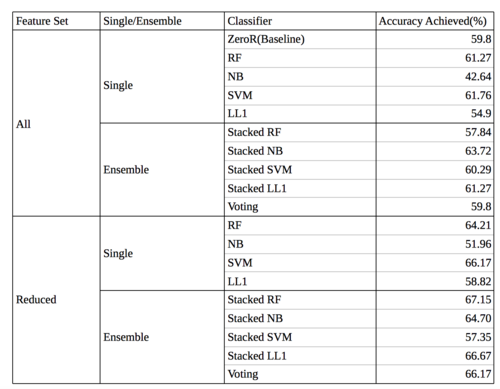
Accuracy for Curiosity


From the tables, it can be observed that the accuracy of the methods become better as the number of features are reduced and ensembles are used. However, whether these improvements are significant or not can only be confirmed by analyzing the results for statistical significance.
Results Analysis
As mentioned in the previous section, the results seem promising, i.e. as the feature set was reduced and ensembling was introduced, performance kept getting better. We would like to know whether this improvement in performance is arbitrary or it is statistically significant. Before we go any further a brief introduction to statistical significance and ANOVA would be fruitful.
Statistical Signifcance
We call results to be statistically significant when we can make sure that the results obtained are due to manipulation of some independent variable and not by pure coincidence. In the context of this study, statistical significance would mean that the improvement in performance is due to the changes done to the dataset and feature set, not arbitrarily acquired. Usually called the significance value or p-value; in simpler terms it means that, what is the probability that the results acquired are due to pure chance and not due to manipulation done by the independent variable[In this case the experimental procedure]. In a ANOVA table, the significance is written at the far right corner. If the significance value given is .01, then it means there is only 1% chance that this result is found by mere coincidence. As, from a machine learning perspective, we want to make sure that results obtained are genuine and the accuracy is not by mere chance or good luck; so, looking for statistical significance makes sense.
As far as acceptable p values are concerned, p values under .05 [5% chance of finding given results by mere accident] are deemed to be acceptable and the results obtained are deemed statistically significant.
Analysis of Variance(ANOVA)
ANOVA is a test that simply shows whether the different classes that are defined are separate from each other or not. In other words, in an experimental setting if the researcher claims certain groups of people or certain classes of artifacts to be different from each other, ANOVA simply makes sure that the classes are indeed different and the difference itself is statistically significant. ANOVA does that by taking the class means of each class and trying to fit a gaussian distribution to it. If the fitted gaussian distributions have means that are far enough, the classes defined are deemed statistically significant.The following illustration can be particularly helpful in explaining the concept of ANOVA

In the picture above, as we can see there are two gaussian distributions. As we can see, there is overlap between these two classes. Now, it can be argued that they are indeed one single class and one gaussian distribution could be fit to explain all of this variance. ANOVA simply makes sure whether such a claim is right or dubious. In this experiment, we divided the accuracies obtained by different classifiers into 5 classes; each class having some change in the classification methods applied or having some changes in the feature set used. For each of the datasets, majority class prediction accuracy was taken as class 1(baseline),accuracies for running the four classifiers(NB,RF,LL1,SVM) on the whole dataset was dubbed class 2, using ensembles on the whole dataset was assigned class 3, accuracies for running the four classifiers(NB,RF,LL1,SVM) on the reduced dataset was dubbed class 4 and using ensembles on the reduced dataset was assigned class 5. Performing an ANOVA and getting significant p-values [<.05] would mean that the division of these classes is statistically significant and it is possible to fit separate gaussian distributions to all of them without much overlap. Putting it in simpler terms, the latter classes have means [mean accuracies] that are significantly different from the means of the previous classes. Now if the ANOVA shows such statistical significance, this would mean the improvement in performance is indeed due to the experimental methods, not by coincidence.
Since we have two datasets which were manipulated separately, two One-Way ANOVAs were run in SPSS [for both boredom and curiosity].As mentioned before, during analysis, each of the prediction methods were considered as their own class, so that comparative analysis becomes easier. For, each of the ANOVAs, separate Shapiro-Wilk(SW) tests were done to test for normality. To test for homoscedasticity, two separate Levene's tests were performed. In both ANOVAs the data maintained both of the necessary assumptions of homoscedasticity and normality.
ANOVA on the Boredom data
The ANOVA run for prediction accuracies achieved on the boredom dataset yielded the following results:
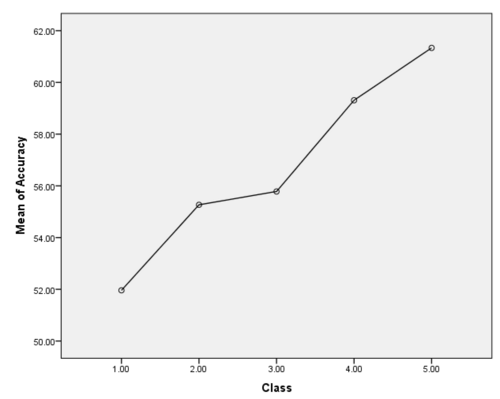
Mean Plot for Boredom
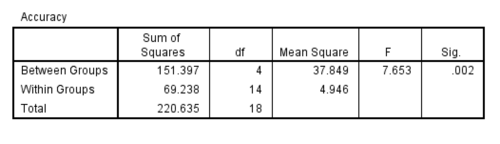
ANOVA for Boredom


As the mean plot shows, the accuracy goes strictly up which means increase in accuracy for each class. Also, the significance value found is .002 which is less than .05; hence the results found are statistically significant. The result of the ANOVA can be summarized as follows:
An omnibus one-way analysis of variance(ANOVA) suggested the number of unnecessary features present and the use of ensembles to
influence prediction accuracy scores on the data,F (4, 14) = 7.653, = .686, p = .002. Since,there was only one data for the
baseline class,no post hocs were performed.

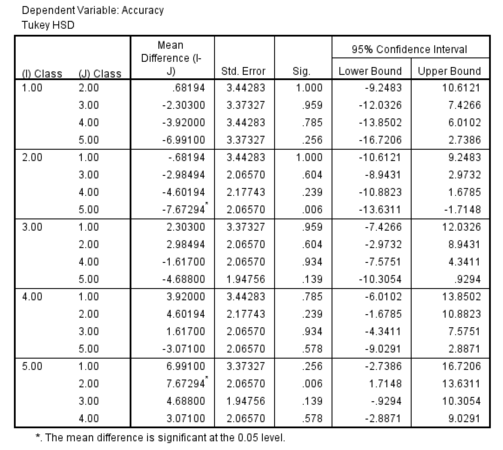
For post-hoc analysis, the baseline was omitted and another ANOVA was performed which also turned out to be significant , . A Tukey’s HSD post hoc test (using ) yielded the following output table:

![{\displaystyle \eta ^{2}=.628,p=.003]}](https://wiki.ubc.ca/api/rest_v1/media/math/render/svg/51442c638c0a256ebe1b2725a3732102f7fde77b)


The table could be interpreted as follows:
Results from a Tukey’s HSD post hoc test (using ) showed that each change in classification method or feature set can be associated with higher accuracy scores, where the improvements are significant at the fifth class mark. The fifth class(ensemble
with less features) had significant performance than both the second (classifiers on the entire dataset) and the third class
(ensembles on full dataset)
ANOVA on the Curiosity data
The ANOVA run for prediction accuracies achieved on the curiosity dataset yielded the following results:
Mean Plot for Curiosity
ANOVA for Curiosity


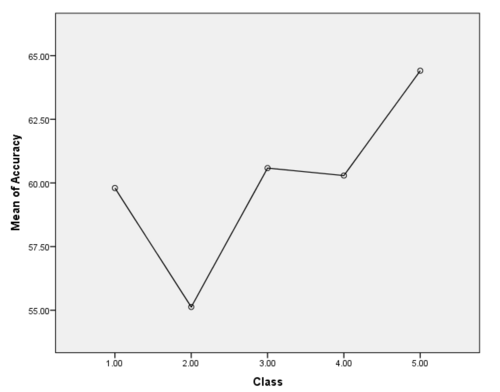
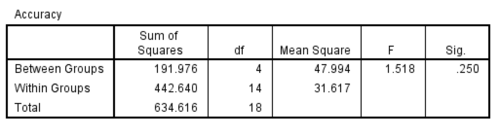
As the mean plot shows, the accuracy does not strictly go up at the very beginning but has a upward trend in general. The first dip in accuracy can be attributed to majority class being a bit imbalanced for this particular classification problem.The significance value found is .250 which is greater than .05; hence the results found are not statistically significant. The result of the ANOVA can be summarized as follows:
An omnibus one-way analysis of variance(ANOVA) suggested the number of unnecessary features present and the use of ensembles did
not significantly influence prediction accuracy scores on the data, F (4, 14) = 1.518, = .302, p >.05. Since,there were no
main effects,no post hocs were performed.
Since, the prediction accuracy increase was not significant but the mean graph had an upward trend in general; another ANOVA where prediction accuracy data used in the two aforementioned ANOVAs were put together to find whether there was a significant improvement in general.
ANOVA on the combination of both
Since, one of the ANOVAs came to be statistically significant and the other one as not, one idea for making sure the improvement is significant in general would be to combine the accuracy results and perform an ANOVA on the combination of both classes. The ANOVA run for prediction accuracies achieved on the combined dataset yielded the following results:
ANOVA for combined data
Mean Plot for Combined data
Tukey's for combined data


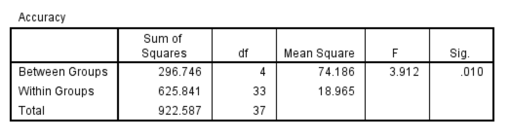
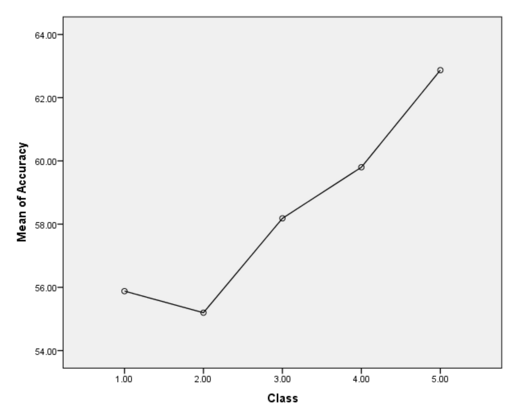
As the mean plot shows, the accuracy has a upward trend in general. Also, the significance value found is .01 which is less than .05; hence the results found are statistically significant. Post hocs reveal that the improvement in accuracy after reducing the features and using ensemble on those[Class-5] is statistically significant when compared to results obtained by using any single classifier[Class-2]. The result of the ANOVA can be summarized as follows:
An omnibus one-way analysis of variance(ANOVA) suggested that the number of unnecessary features present in data and the use of ensembles, has signficant influence over the prediction accuracy in general ,F (4, 33) =3.912, = .321, p = .010. Results from a Tukey’s HSD post hoc test (using ) showed that each change in classification method or feature set can be associated with higher accuracy scores, where the improvements being significant at the fifth group mark. The fifth group(ensemble with less features) had significantly better accuracy scores than the second(classifiers) group. However, there were no main effects for the average of the two baseline(i.e. class-1).
Future Works
Future inquiry for this problem could be using the proposed method on a bigger dataset having various emotions. Whether, Logistic Regression with L1 regularization still remains a valid feature selection tactic and whether using ensembles on the reduced featureset still gives significantly better results is also something that can be inquired upon. Again, newer datasets could incorporate input from other sensors which might give new perspective on the matter. Finally, in many application domains [e.g. image processing] sparsity inducing patterns are employed iteratively to make sure one gets better results. Whether this can be done for this dataset is also interesting to explore.
Discussion
Based on the tests done regarding this hypothesis, it can be said that having Logistic Regression with L1 regularization as a feature selection method along with ensembling, can improve performance in general. However, it might not improve the performance in a statistically significant manner. Further, inquiry is needed to get definitive proof in this direction.
Annotated Bibliography
- ↑ 1.0 1.1 1.2 1.3 1.4 Predicting Affect from Gaze Data During Interaction with an intelligent Tutoring System- Natasha Jaques, Cristina Conati, Jason Harley, Roger Azevedo
- ↑ 2.0 2.1 Feature selection, L1 vs. L2 regularization, and rotational invariance- Andrew Y. Ng
- ↑ Is Combining Classifiers with Stacking Better than Selecting the Best One?- SASO DZˇEROSKI, BERNAR DZˇENKO
|
|